
Apache Solr Succinctly®

CHAPTER 3
Solr Configuration
Getting Solr
The first step to get a working installation of Solr is to actually download it, which you can do here. You can also find it by typing “download Solr” into your favorite web search engine.
- Solr homepage
Click Download so that you are redirected to the appropriate mirror site for downloading Solr’s latest version. In this case, since I’m running Windows, I will be downloading the zip file, solr-4.10.2.zip. Source code is also available for download in solr-4.10.2-src.tgz, and if you need an older version of Apache Solr, you can go to the Apache archives.
The file may take some time to download due to its 150-MB size. While you wait, now is a good time to start checking your prerequisites, mainly Java. In older versions you could run on Java 1.6, but with Solr 4.8 and above, you need Java 7 (hopefully update 55 or later, as there are known bugs in previous versions). At the time of writing of this book, 4.10.2 is Solr’s latest version.
To confirm you have the correct Java installed, open the Windows command line, which can be done via the Windows key + R, or typing cmd in the Start menu or Run screen. Now, within the command line, please type java –version. The response will tell you which version of Java you are running. A ‘java’ is not recognized as an internal or external command response means Java is not properly installed. Please go back to Java’s installation instructions, making sure the environment variable PATH correctly points to the Java directory. A correct installation will show the following:

- Output that should be seen from running "java -version"
I have Java 1.6 update 67, which means I am good to go.
Once your download is complete, extract all contents into a folder called c:\solr-succinctly in the root of your hard drive.
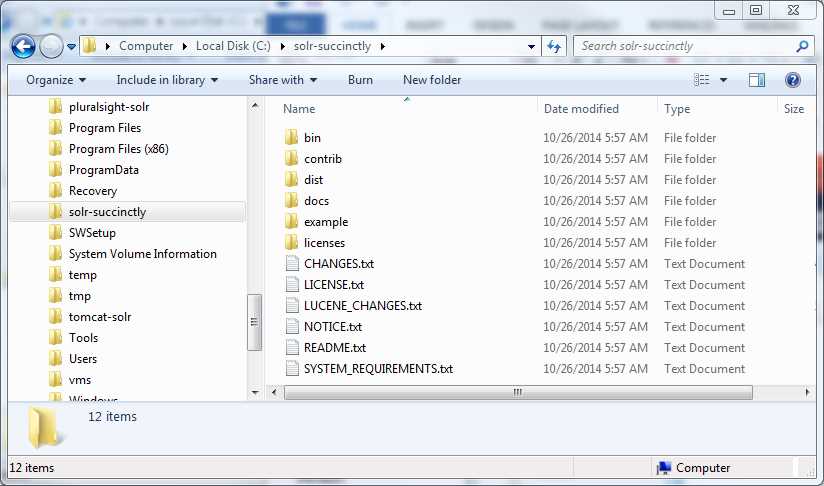
- Solr unzipped
In the solr-succinctly directory, you will find several folders and files. First, there are a few text files, which include changes, license, notice, readme, and system requirements.
In the example folder, you will find a fully self-contained Solr installation. It comes complete with a sample configuration, documents to index, and a web application server called Jetty for running Solr directly out of the box. Remember, if you are a .NET developer, Jetty will be the equivalent of IIS.
The Jetty application web server provided with this distribution is meant for development purposes. However, there are full distributions of the same software available for production use when you reach that point.
In the dist folder, you should find a file named Solr.war; this is the main Solr application that you deploy to your application server in order to run Apache Solr. This folder also contains many useful JAR files. To clarify, a JAR (Java Archive) is a package file format typically used to aggregate many Java class files and associated metadata and resources (such as text, images, etc.) into one file to distribute application software or libraries on the Java platform.
In the contrib folder, you should find Solr’s contribution modules. As with many open source projects, what you'll find in here are extensions to Solr. The runnable Java files for each of these contrib modules are actually in the dist folder.
In the docs folder, you'll find HTML files and assets that will increase your understanding of Solr. You’ll find a good, quick tutorial, and of course, Solr’s core API documentation.
I’ve seen a few people copy only the example folder to get Solr started, especially during local deployments for development. It works, but will present you with a number of problems, as there are dependencies that you'll almost definitely need to make things run correctly. It's always best to copy the entire contents of the downloaded zip file. Paths are relative, however, meaning you can easily rename example to something more meaningful without causing any significant issues.
For my purposes throughout this book, I'll rename my cloned folder succinctly.
Starting Solr
Now that we have Solr, let’s fire it up and get the party started!
At this point you might be expecting a solrinstaller.exe. This is not how it works. It is a bit different, although not complicated at all.
We’re now ready to run the Solr development environment using the included application web server Jetty. A word of advice: Jetty is included with Solr, but it is not the only option. I also use Tomcat for production purposes, and there are other alternatives. The bundled-in Jetty just makes it a lot simpler to get started quickly.
I am using Windows right now, but the process is very similar in other operating systems.
The steps are extremely simple:
- Open the command line, which can be done by typing cmd in the Windows Run dialog. The Run dialog can be displayed with the Windows key + R.
- Change the folder to the one you created previously, where you extracted Solr. Then, go into the succinctly folder, which you recently cloned from example.
- Now run java -jar start.jar. If all goes as expected, the console will start loading. Initialization steps will be displayed in the command line; please expect a large of amount of text to be shown. This is normal.
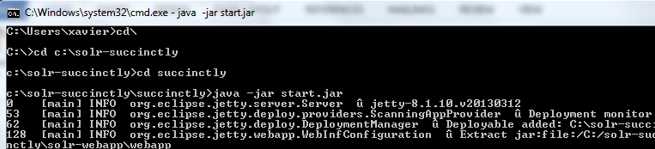
- Starting Solr
- And finally, the most important part of the setup: open a browser and navigate to http://localhost:8983/solr. If you see the following, you should be smiling, because you have Apache Solr running:
- Solr up and running
If you don't see the screen in Figure 9 in your browser, or if Solr does not load, please review the text output in your console. Exceptions are visible in the messages—though sometimes they are hard to find. The most likely scenario where Solr will not load is if there are errors in the configuration files, most likely due to changes that have been made while experimenting.
Configuring Solr in a Different Port
Now it's time to learn how to make configuration changes to Solr. For our first example, we will perform a very simple change to run it from a different network port. This change is a common scenario, and usually required for things like corporate firewall rules. The following steps will guide you through this process:
- Navigate to the etc folder using Windows Explorer.
- Open the jetty.xml configuration file with your text editor of choice. Notepad++ is a good recommendation.
- Look for the word port and within the node <New class="org.eclipse.jetty.server.bio.SocketConnector"> you will see a subnode with the default port 8983. Please make sure you are replacing the correct one, which is not commented out.
- Change it to 8984.
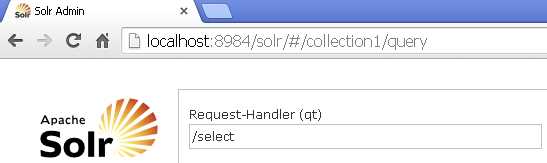
- Go back to the Admin UI, modify your URL to point to the new port, and refresh.

- Solr in another port
As you can see, the new port is not yet working as expected. You need to restart Solr. This is NOT a hot swap change!
To stop the current Solr instance, you need to change to the window where you started Solr, and then press Ctrl + C so the service shuts down. Then restart using the same command as before, java-jar start.jar. Solr will start. Now, if you refresh your browser, once again you'll see Apache Solr, easy as that.
- Restarting Solr
At this point I will revert back to using 8983, the default port, and restart Solr. These steps apply only when using Jetty as an application web container. If you use Tomcat or another container, you’ll need to use different configuration instructions.
Solr’s Admin UI
Solr features a web interface that makes it easy for administrators and programmers to view the Solr configuration details, run queries, analyze document fields, and fine-tune a Solr instance, as well as access online documentation and help. As shown in Figure 12, the admin section is made up of the sections Dashboard, Logging, Core Admin, Java Properties, and Thread Dump. There's also core selector (a drop-down list) with multiple different functionalities, and the main working pane to the right of the menu.
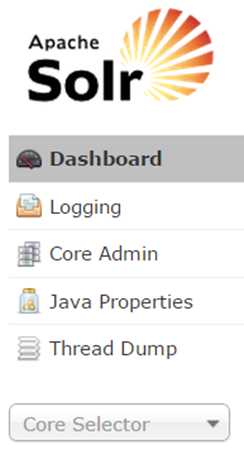
- Solr menu
If you've already pointed your browser at http://localhost:8983/solr, then you’re ready to review each section in turn.
Getting Assistance
Underneath the main work pane, you'll see a small, icon-driven menu.
The main objective of this menu is to give you quick access to the various help and assistance resources available to Solr users. It is made up of the documentation, which is hosted here, and has links pointing to the official issue tracker located on the JIRA network. There’s also a link to the Solr IRC channel, the community forum, and the Solr query syntax guide, all of which is going to be very useful.
![]()
- Solr's working pane menu
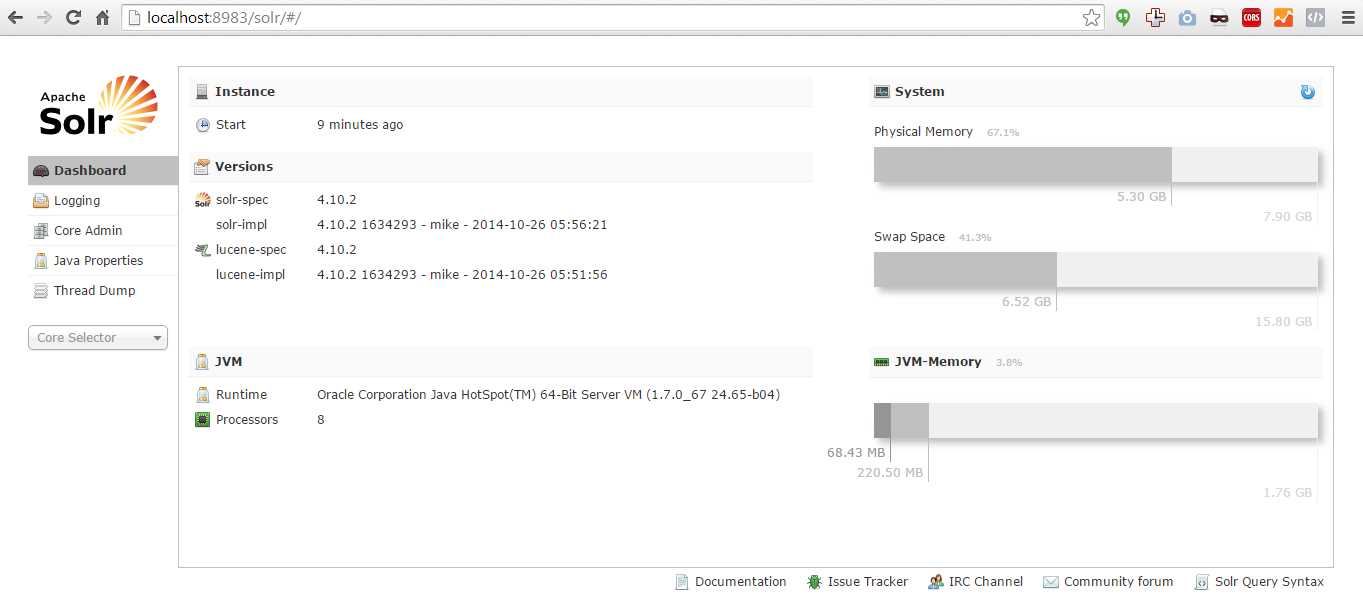
Dashboard
The Dashboard is the default section that is loaded when you navigate to the Admin UI. It displays information it collects on your Instance, System, and Java Virtual Machine (JVM). Depending on your configuration, it has been observed that the memory graph may not display information when Windows virtual memory is set to automatic, or when the system is configured not to use Swap memory.
Logging
The Logging section displays messages from Solr's log file. When you start Solr, you only have one core, but if you have multiple cores, then all of the messages will be displayed.
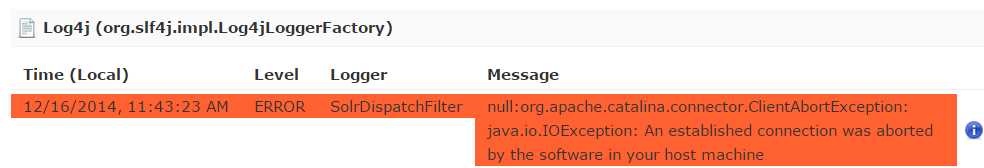
- Solr Logging
Underneath the Logging menu item, you see the hierarchy of class maps and class names for your instance. Click the column at the right and select the logging level from All, Trace, Debug, Info, Warn, Error, Fatal, Off, and Unset as shown in Figure 15.
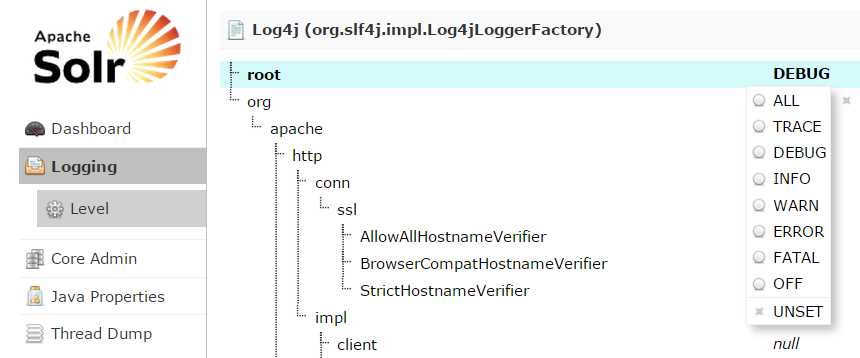
- Solr Logging hierarchy
Core Admin
As you might remember from a previous section, we mentioned Lucene cores. A core is a full copy of a Lucene index with its own schema and configuration.
You can manage your cores in the core admin section. The buttons at the top allow you to add a core, unload one of the existing cores, rename a core, swap a core, reload the core with any changes made since the last reload, and optimize a core.
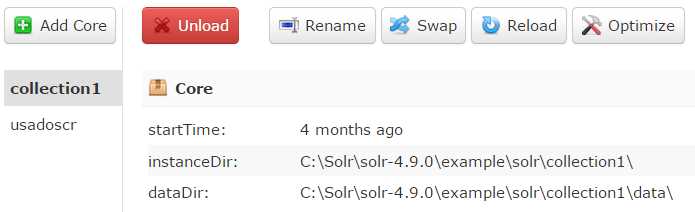
- Core admin
Tip: When you click the Reload button, you have to wait for the button to turn green, or your changes will not take effect. The commands here are the same ones available through the core admin handler, but they are provided in a way that is easy to work with. If there are problems loading the core, you will see the exceptions in the log, or if you started from the console, the commands will also be displayed there. Restarting Solr will also load all cores, including new ones.
Java Properties
The Java Properties screen allows easy, read-only access to one of the most essential components of a top-performing Solr system. It allows you to see all the properties of the JVM running Solr, including the class paths, file encodings, JVM memory settings, operating system, and more.
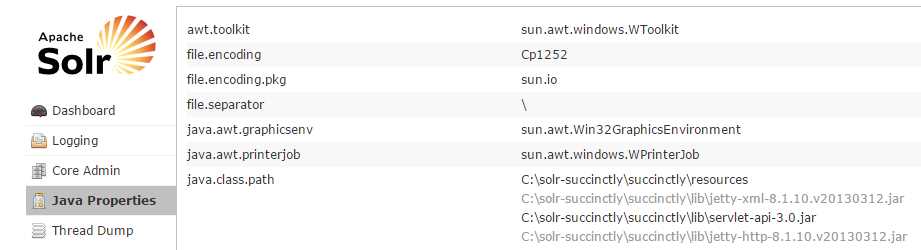
- Java Properties Thread Dump
The Thread Dump screen lets you inspect the threads currently active in your server. Each thread is listed, and access to the stack traces is available where applicable. There's also an icon that indicates state; for example, a green check mark signifies a runnable state. The available states are new, runnable, locked, waiting, time waiting, and terminated.
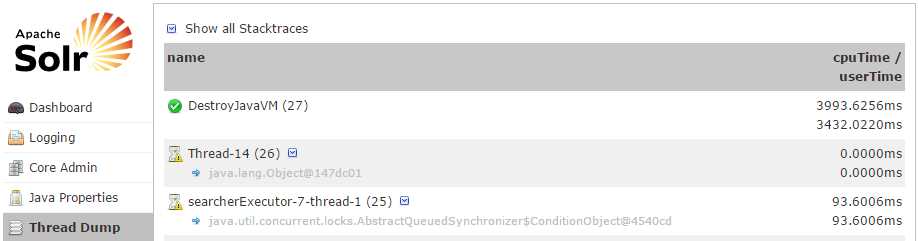
- Thread Dump
Core Selector
The core selector allows you to select or find a specific core. Click Core Selector, and a drop-down menu will appear. You can start typing your core’s name, which comes in handy when you have many cores, or you can click the name of your desired core. Once you have selected your core, you’ll be able to perform core-specific functions. When you click on the core, it will start by displaying the Overview with the statistics for this particular core.
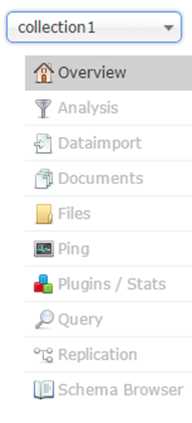
- Core drop-down menu
Analysis
The Analysis screen lets you inspect how your data will be handled during either indexing or query time, according to the field, field type, and dynamic role configurations found in the schema.xml. Ideally, you would want content to be handled consistently, and this screen allows you to validate them in the field type or field analysis chains.
This screen is also very useful for development when selecting analyzers for debugging purposes. Analyzers will be mentioned later in this book.
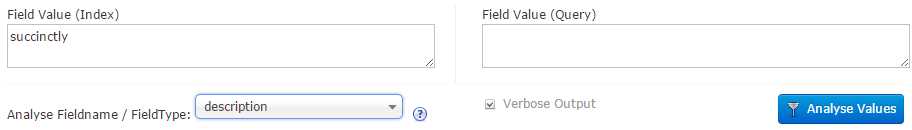
- Analysis
DataImport
Some of the most common data sources include XML files and relational databases. Therefore, we need an easy way to import from databases and XML files into Solr. This is achieved using the DIH or data import handler. It is a contrib that provides a configuration-driven way to import data into Solr in both full builds and incremental delta imports. The DIH within the admin UI shows you the information about the current statuses of the data import handler.
In the current instance, there are no data import handlers configured, and they will not be covered in this book. However, if you want to learn how to configure and use data import handlers, your current Solr download comes with a predefined example that is easy to start and test. Please go to the example-DIH folder in C:\solr-succinctly\example\ and open Readme.txt. Follow the instructions you find there to get started.
Documents
The Documents screen allows you to execute multiple Solr indexing commands in a variety of formats directly from the browser. It allows you to copy or upload documents, JSON, CSV, and XML and submit them to the index. You can also construct documents by selecting fields and field values. You should always start by defining a request handler to use by typing the name of the handler in the Request-Handler (qt) textbox. By default, /update will be defined.
- Request handler
Files
The Files screen is used to browse and view the various configuration files for a specific core (for example, solrconfig.xml and schema.xml). It is read-only, and it is a great way to access your files without having to actually log into the machine.

- Files screen
Ping
You can ping a specific core and determine if it is active. It is very simple to use; simply click this option, and it tells you how many milliseconds it took for it to respond.
Plugins and Stats
The Plugins and Stats display shows statistics like the status and performance of the caches, searches, and configuration of handlers for both search as well as request handlers. A snapshot is taken when the page is loaded, and you can either watch changes or refresh the values by clicking on the marked menu items.
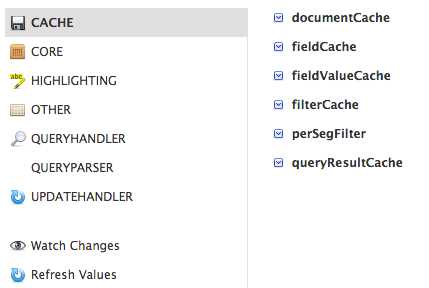
- Plugins and Stats
Query
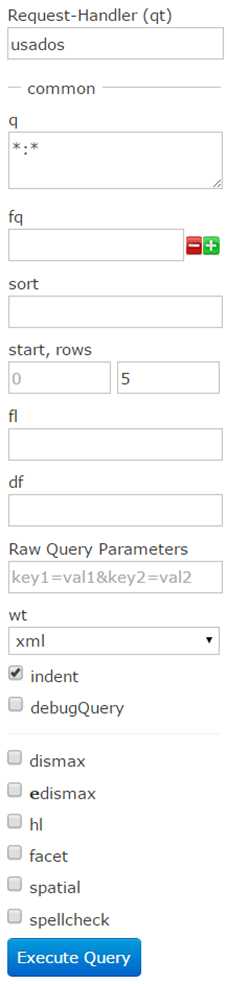
The Query section is probably one of the most important parts of the admin UI. It's where you submit a structured query and analyze the results. The Admin UI includes a set of options for the multiple available parameters to make the user’s life simpler, including:
- request-Handler(qt): Specifies the request handler to use; it uses the standard if it's not specified.
- q: The query, for which results returned will be ranked from more relevant to least relevant.
- fq: The filter query, basically used to narrow down result sets. The difference with q is that fq does not affect ranking.
- sort: Tells Solr by which field you want sorting to be applied, either ascending or descending.
- start, rows: Controls how many results and starting where should be returned. Used mainly for paging.
- fl: Specifies which fields should be returned in the response. If not specified, all are returned. In Solr 4 and above, you can specify functions (a more advanced topic).
- df: The default field; it will only take effect if the qf (Query Fields) is not defined.
- wt: The response writer, which indicates how to format the response; for example, XML or JSON.
- indent: Makes it more readable.
- debugQuery: Used to display debug information
- dismax: Ticking this checkbox displays the DisMax query parser parameter. DisMax is already the default query parser in newer versions of Solr.
- edismax: Displays the Extended Dismax Parameters, which is an extended query parser used to overcome the limitations of DisMax.
- hl: Enables highlighting of results.
- facet: Displays faceting parameter options.
- spatial: Shows options for spatial or geo-spatial search.
- spellcheck: Enables spell checking of results.
If an option is not available in the Admin UI, there is always the “Raw Query Parameters,” which basically just passes along verbatim the specified parameters to Solr.
The options I just mentioned will be covered more in Chapter 8, “Searching and Relevance.” chapter.
When you execute a query within the Admin UI, the results will load in the right-most panel. This makes it very simple to run queries, review results, tweak, and run queries again.
Depending on your browser and configuration, one tip that I have for you is to open the results within the browser and use XML instead of JSON. I normally use Google Chrome, and the browser presents the XML in such a way so that you can expand and contract each section, making it easy to view all results. Simply click the box with a link above the results that looks like the one shown in Figure 24:
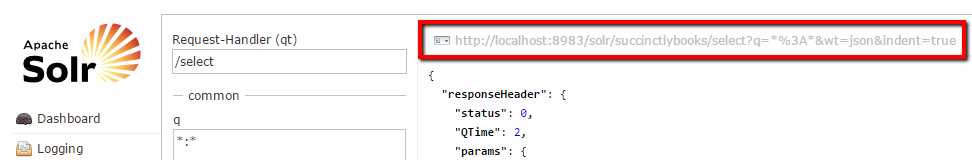
- Click to open query
Now let’s take a quick look at a response, which is made up of several sections that can include the following:
- Response header: Includes the status, the query time, and the parameters.
- Results: Includes the documents returned from the search engine that match the query in doc subsections.
- Facets: Items or search results grouped into categories that allow users to refine or drill down in specific search results. Each facet also displays number of hits within the search that match each specific category.
I encourage you to play around and experiment with the query section; this is where you learn the most about Solr.
The following figure shows you how a typical response might look:
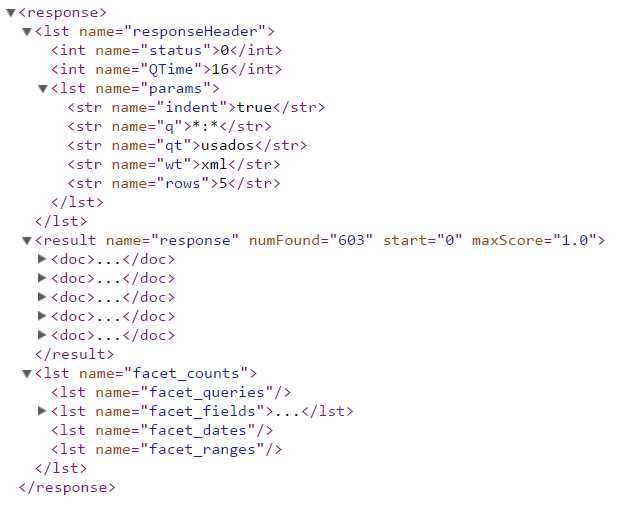
- Example of a Solr response
Replication
Replication using Master and Slave nodes is the old method of scaling in Solr. The replication screen lets you enable or disable replication. It also shows you the current replication status; in Solr, the replication is for the index only.
Replication has been superseded with SolrCloud, which provides the functionality required to scale a Solr solution. However, if you're still using index replication, you can use this screen to see the replication state.
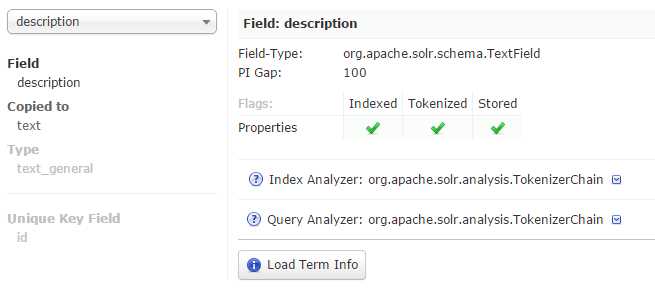
Schema Browser
The Schema browser displays schema data. It loads a specific field when opened from the analysis window, or, if you open it directly, you can select a field or field type. If you click on the load term info, it will show you the top end terms that are in the index for that field. And if you click on a term, you will be taken to the query screen to see the results of a query of that term in that field.
You can load the term information for a field if there are terms for that specific field. A histogram will show the number of terms with a given frequency in that field. This may be a bit confusing in the beginning, but later on it will be pretty useful.
- Schema browser
Summary
We have concluded the quick tour of the Admin UI. The objective was to provide you with an overview of the many different components of the Admin UI, and explain what are they used for.
The next step in this journey is to move on to understanding how we model our data according to Solr’s needs, and for this purpose, we will use the sample data provided.
- 1800+ high-performance UI components.
- Includes popular controls such as Grid, Chart, Scheduler, and more.
- 24x5 unlimited support by developers.