Overview
The .NET MAUI radial bar chart is ideal for rendering circular bars and comparing values between various categories. You can create beautiful, animated, real-time, and high-performance radial bar charts that support interactive features such as tooltip and selection.

Key features
Custom radius
Customize both the inner and outer radii of the .NET MAUI radial bar chart to make it precisely the needed size.

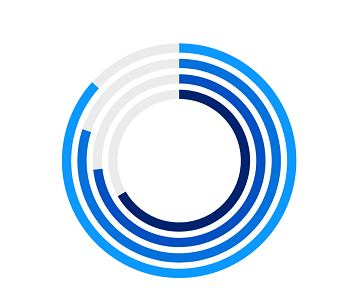
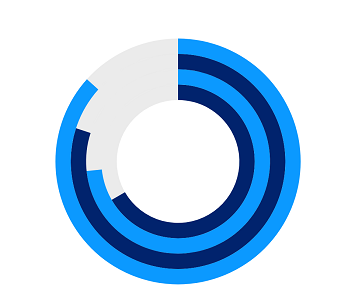
Corner style
Customize the start and end of the .NET MAUI radial bar chart segments by rendering flat or curved corners.

Customization
Customize the look and feel of the .NET MAUI radial bar chart using built-in APIs.
Palette color
Set the desired palette colors for the segments of the .NET MAUI radial bar chart.
Code example
Easily get started with the .NET MAUI radial bar chart using a few simple lines of XAML and C# code as demonstrated below.
<ContentPage xmlns="http://schemas.microsoft.com/dotnet/2021/maui"
        xmlns:x="http://schemas.microsoft.com/winfx/2009/xaml"
        x:Class="ChartExample.MainPage"
        xmlns:local="using:ChartExample"
        xmlns:chart="clr-namespace:Syncfusion.Maui.Charts;assembly=Syncfusion.Maui.Charts">

    <Grid>
        <chart:SfCircularChart HorizontalOptions="FillAndExpand" VerticalOptions="FillAndExpand">
            <!--Setting BindingContext-->
            <chart:SfCircularChart.BindingContext>
                <local:ViewModel/>
            </chart:SfCircularChart.BindingContext>

            <!--Adding Radial Bar Series to the .NET MAUI Circular Chart-->
            <chart:RadialBarSeries ItemsSource="{Binding Data}"
                    XBindingPath="Month" YBindingPath="Target">
            </chart:RadialBarSeries>
        </chart:SfCircularChart>
    </Grid>
</ContentPage>
public class Model
{
public string Month { get; set; }
public double Target { get; set; }
public Model(string xValue, double yValue)
{
Month = xValue;
Target = yValue;
}
}
public class ViewModel
{
public ObservableCollection<Model> Data { get; set; }
public ViewModel()
{
Data = new ObservableCollection<Model>()
{
new Model("Jan", 50),
new Model("Feb", 70),
new Model("Mar", 65),
new Model("Apr", 57),
new Model("May", 48),
};
}
}Learning resources


.NET MAUI Radial Bar Chart User Guide
Learn about the options available to customize the .NET MAUI radial bar chart.
