Overview
The .NET MAUI pie chart is a circular graphic, which is ideal for displaying proportional values in different categories. Pie charts support animation and interactive features such as tooltip and selection.

Key Features
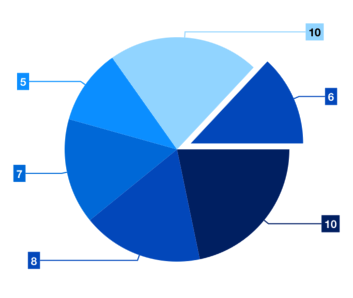
Explode Segments
Explode a slice in the .NET MAUI Pie Chart to differentiate it from other slices.

Semi Pie
Configure the semi pie for compact visualization and reduction of rendering area.
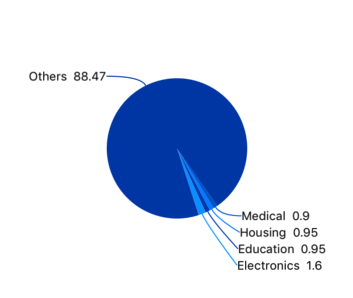
Data Labels
Data labels display information about the data points. Customize the labels’ foreground, border, and background. Rotate a data label by its given angle.
Code Example
Easily get started with .NET MAUI Pie Chart using a few simple lines of XAML and C# code, as demonstrated below.
<ContentPage xmlns="http://schemas.microsoft.com/dotnet/2021/maui"
        xmlns:x="http://schemas.microsoft.com/winfx/2009/xaml"
        x:Class="ChartExample.MainPage"
        xmlns:local="using:ChartExample"
        xmlns:chart="clr-namespace:Syncfusion.Maui.Charts;assembly=Syncfusion.Maui.Charts">

    <Grid>
        <chart:SfCircularChart HorizontalOptions="FillAndExpand" VerticalOptions="FillAndExpand">
            <!--Setting BindingContext-->
            <chart:SfCircularChart.BindingContext>
                <local:ViewModel/>
            </chart:SfCircularChart.BindingContext>

            <!--Adding Pie Series to the .NET MAUI Circular Chart-->
            <chart:PieSeries ItemsSource="{Binding Data}"
                    XBindingPath="Month" YBindingPath="Target">
            </chart:PieSeries>
        </chart:SfCircularChart>
    </Grid>
</ContentPage>
public class Model
{
public string Month { get; set; }
public double Target { get; set; }
public Model(string xValue, double yValue)
{
Month = xValue;
Target = yValue;
}
}
public class ViewModel
{
public ObservableCollection<Model> Data { get; set; }
public ViewModel()
{
Data = new ObservableCollection<Model>()
{
new Model("Jan", 50),
new Model("Feb", 70),
new Model("Mar", 65),
new Model("Apr", 57),
new Model("May", 48),
};
}
}Learning Resources

Explore the .NET MAUI Pie Chart example from GitHub to learn how to render and configure charts.

.NET MAUI Pie Chart User Guide
Learn more about the available options to customize .NET MAUI Pie Charts.
