How to create radial chart in figure?

How to create radial chart in figure?
-----------------------------------------------------------------------------------------------------------------
Gorgeous effects are used in the picture, and to simplify the illustration, I have re-expressed the meaning of this picture in color.
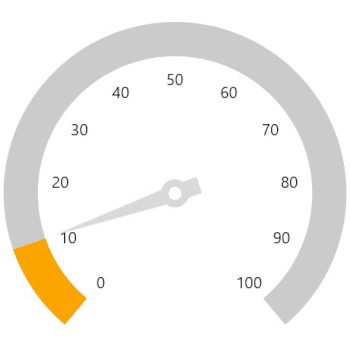
The first picture shows the scale of this gauge.
The track uses a gradient color, and for illustration, a magenta-blue gradient is used;
Scales are displayed in green without gradient

---------------------------------------------------------------------------------------
Based on the first image, I need to create a gradient highlight scale.
Here, use a white to blue gradient with the direction indicated by the arrow.
In addition, I also need a radial gradient, which is represented by red to transparent color in the picture.

!!!!!!!
It should be noted that I need to ensure that the white part is always at the end of the progress bar, as shown by the yellow circle in the picture
Your progress bar supports spring animation, but the gradient color of the progress bar does not. This is where I need the most help.

Hi Shompinice,
Query: The first picture shows the scale of this gauge. Scales are displayed in green without gradient.
With the addition of two radial axes, we have achieved this requirement. We added multiple ranges that are all displayed in solid green on the first axis.
Query: Based on the first image, I need to create a gradient highlight scale. Here, use a white to blue gradient with the direction indicated by the arrow. In addition, I also need a radial gradient, which is represented by red to transparent color in the picture.
As per your requirement we can highlight the scale using range pointers. Range pointers support gradient color support so we can add blue to white gradient colors. We used another range pointer to add a radial gradient.
Query: Your progress bar supports spring animation, but the gradient color of the progress bar does not. This is where I need the most help.
We are unable to understand your requirement clearly. Please provide more details about your requirement, including images or short videos, so we can better understand your needs.
Please refer to the sample in the attached attachment and let us know if it meets your requirements. If not, please provide more details and we will work to provide an appropriate solution as soon as possible.
Regards,
Eswaran
Attachment: ProgressiveScale_5bc48bd8.zip
This control allows the Animation Easing Function to increase the elastic effect.
But the problem is that this animation only works on the progress, not on the color of the progress bar.
I want the white part of the blue-white gradient in the picture to always be at the end of the progress bar when the easing effect is turned on.
Query 1: Problem is that this animation only works on the progress, not on the color of the progress bar.
We investigated the reported issue and found that the animation works correctly for both the range pointer and color. Please refer to the tested video in the attached attachment.
If the issue persists, please provide an updated sample based on your scenario and additional information. This will help us to provide a better solution as soon as possible.
Query 2: I want the white part of the blue-white gradient in the picture to always be at the end of the progress bar when the easing effect is turned on.
Our development team is currently investigating the possibility of implementing this requirement. We will update you with further details within 2 business days.
Attachment: Coloranimation_RadialGauge_9e73080f.zip
Query: I want the white part of the blue-white gradient in the picture to always be at the end of the progress bar when the easing effect is turned on.
Currently, we are analyzing the reported scenario in the source level. We will update you on the further details on January 24, 2023. We appreciate the patience until then.
Query: I want the white part of the blue-white gradient in the picture to always be at the end of the progress bar when the easing effect is turned on.
RangePointer ValueChanged Event can be used to meet your requirement. By dynamically updating the Value property of GradientStop in the ValueChanged Event of RangePointer, we can keep the white part of the blue-white gradient in the picture always at the end of the progress bar. We have prepared the sample to achieve your requirement and please get it from the below attachment.
Attachment: ProgressiveScale_addd60d1.zip
- 5 Replies
- 2 Participants
-
SH Shompinice
- Jan 13, 2023 05:17 AM UTC
- Jan 24, 2023 12:36 PM UTC
