I would like to know how I can group data in a pie chart, getting it from firestore.
Cheers
I would like to know how I can group data in a pie chart, getting it from firestore.
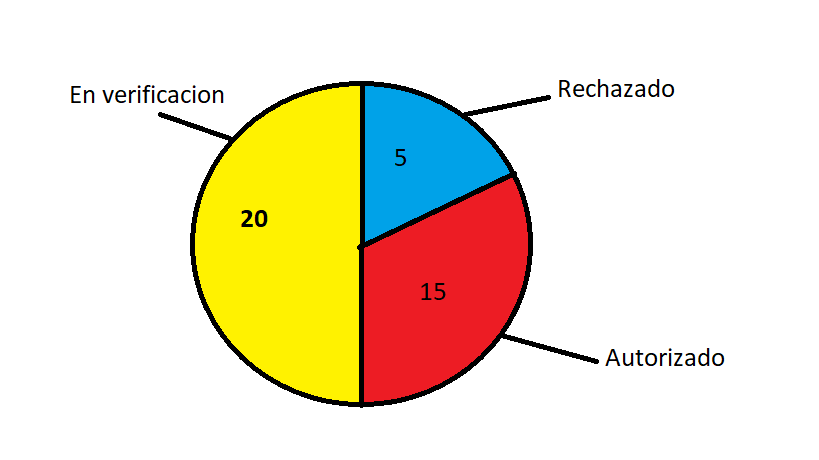
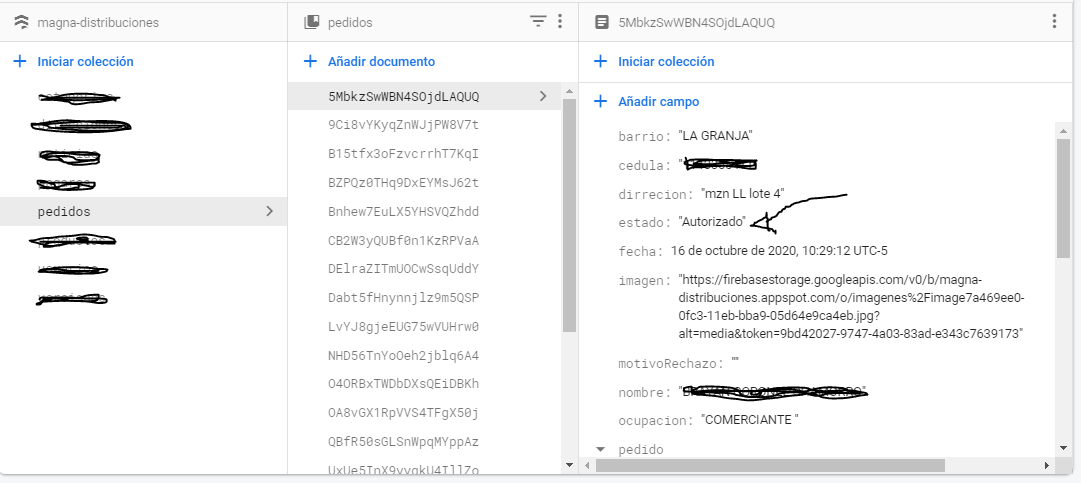
I have a collection of requests, which in turn has a field called status (En verificacion, Rechazado, Autorizado).
I want to know how I can create a graph to show me the amount that exists in each state.
I appreciate your help in advance.
Example
Example
SIGN IN To post a reply.
3 Replies
1 reply marked as answer
SK
Sriram Kiran Senthilkumar
Syncfusion Team
November 28, 2020 07:17 AM UTC
Hi Aldair,
Greetings from Syncfusion. We have analyzed your scenario at our end and your requirement regarding grouping data in a pie chart to show the amount that exists in each state can be achieved in the application level itself. Once you have got the collection of request from the fire store, you need to parse into the data collection and check for the types of status available and also check the overall count of each status type available and store the count in a separate integer variable. After that, create and initialize a default chart data collection with two fields one for storing the status types and another field to store its count. Store the count of each state in their respective chart data collection and assign that chart data collection as the data source for the chart. We have also created a simple sample and attached below in which we have carried out the above-explained process for rendering a pie chart to show the amount that exists in each state.
Please check with the above-attached sample and get in touch with us if you still have further concerns.
Regards,
Sriram Kiran
Marked as answer
FW
Felipe Werlang
November 25, 2021 07:46 PM UTC

YG
Yuvaraj Gajaraj
Syncfusion Team
November 26, 2021 02:21 PM UTC
Hi Felipe Werlang,
We have analyzed your query and you can customize the legend text either by using the onLegendItemRender callback or legendItemBuilder property. Using the onLegendItemRender call back, you can customize the text, shape and color of the legend icon. While using legendItemBuilder, you render any customer widgets in the legend. We have created a sample based on the provided image using legendItemBuilder. You can modify this as per your requirement and find the code to accomplish below
Code snippet
|
legendItemBuilder:
(dynamic name, dynamic series, dynamic point, int index) {
return Container(
//Other information
);
}
|
Screenshot:

And to know more on onLegendItemRender callback, find the user guide below
Regards,
Yuvaraj.
SIGN IN To post a reply.
- 3 Replies
- 4 Participants
- Marked answer
-
AR Aldair Ramiro Turizo Gamarra
- Nov 26, 2020 04:34 PM UTC
- Nov 26, 2021 02:21 PM UTC
