Flutter, Firebase, and Syncfusion charts
The Syncfusion charts are perfect for an app I'm writing. I was able to get the charts to work using static data and am now trying to hook it up to my Firebase backend. I have a series of date and a numeric values stored in Firebase collection that I would like to plot as a syncfusion scatter plot. I'm having a hard time figuring out how to convert my list of values to a ScatterSeries list. Some sample code is below. I use a stream to write data to the task object, but I can't figure out how to use the data in this object to populate _seriesDateLength.
Thanks in advance for any help!!
class DateLength {
  final Timestamp mydate;
  final double mylength;
  DateLength(this.mydate,this.mylength);

  DateLength.fromMap(Map<dynamic, dynamic> map)
      : assert(map['date'] != null),
        assert(map['length'] != null),
        mydate = map['date'],
        mylength = map['length'];

  @override
  String toString() => "Record<$mydate:$mylength>";
}
List<ScatterSeries<DateLength, DateTime>> _seriesDateLength;
List<ScatterSeries<DateLength, DateTime>> mydata;
_generateDateLength(mydata) {
  debugPrint("_generateDateLength");
  _seriesDateLength = mydata;//List<ChartSeries<DateLength, Timestamp>>();
  debugPrint("_generateDateLength2");
}

Widget _buildScatterBody(BuildContext context) {
  //debugPrint("CatchesRecords=" + Firestore.instance.collection('catches').snapshots().length.toString());
  return StreamBuilder<QuerySnapshot>(
    stream: Firestore.instance.collection('catches').snapshots(),
    builder: (context, snapshot) {
      if (!snapshot.hasData) {
        debugPrint("nodata");
        return LinearProgressIndicator();
      } else {
        debugPrint("found records " + snapshot.data.documents.length.toString());
        List<DateLength> task = snapshot.data.documents
            .map((documentSnapshot) => DateLength.fromMap(documentSnapshot.data))
            .toList();
        debugPrint("mapped records");
        debugPrint("task.length.tostring:" + task.length.toString());


        return _buildScatterChart(context, _seriesDateLength);
      }
    },
  );
}

Widget _buildScatterChart(BuildContext context, List<ScatterSeries<DateLength, DateTime>> taskdata) {
  mydata = taskdata;
  _generateDateLength(mydata);
  debugPrint("mydata=" + mydata.toString());
  //debugPrint("_seriesDateLength.length=" + _seriesDateLength.length.toString());
  return Padding(
    padding: EdgeInsets.all(8.0),
    child: Container(
      child: Center(
        child: Column(
          children: <Widget>[

            Text(
              'Sample Data',
              style: TextStyle(fontSize: 24.0, fontWeight: FontWeight.bold),
            ),
            SizedBox(
              height: 10.0,
            ),

            Expanded(
              child:
              SfCartesianChart(
                plotAreaBorderWidth: 0,
                title: ChartTitle(text: 'Firebase DateLength'),
                legend: Legend(isVisible: true),
                primaryXAxis: DateTimeAxis(
                  labelIntersectAction: AxisLabelIntersectAction.multipleRows,
                  majorGridLines: MajorGridLines(width: 0),
                ),
                primaryYAxis: NumericAxis(
                    labelFormat: 'Length (in)',
                    axisLine: AxisLine(width: 0),
                    minorTickLines: MinorTickLines(size: 0)),
                tooltipBehavior: TooltipBehavior(enable: true),
                series: _seriesDateLength,
              ),
            ),
          ],
        ),
      ),
    ),
  );
}
SIGN IN To post a reply.
1 Reply
DD
Dharanidharan Dharmasivam
Syncfusion Team
November 18, 2019 01:50 PM UTC
Hi Trevor.
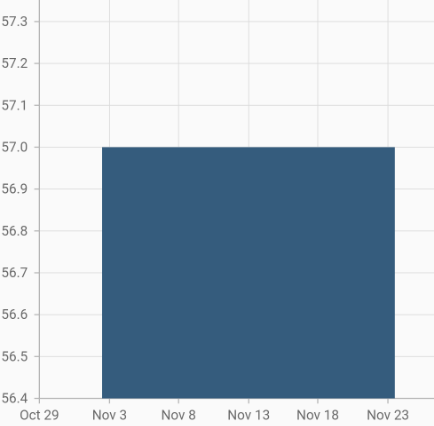
Greetings from Syncfusion. We have created a sample which fetches data from firebase, and we have bound those data to chart. Here we have created a column chart, and this can be modified based on your scenario.
|
final CollectionReference fireData = Firestore.instance.collection('data');
Widget build(BuildContext context) {
return Scaffold(
body: StreamBuilder<void>(
stream: fireData.snapshots(),
builder: (BuildContext context, AsyncSnapshot snapshot) {
Widget widget;
if (snapshot.hasData) {
List<ChartData> chartData = <ChartData>[];
for (int index = 0; index < snapshot.data.documents.length; index++) {
DocumentSnapshot documentSnapshot =
snapshot.data.documents[index];
// here we are storing the data into a list which is used for chart’s data source
chartData.add(ChartData.fromMap(documentSnapshot.data));
}
widget = Container(
child: SfCartesianChart(
primaryXAxis: DateTimeAxis(),
series: <ChartSeries<ChartData, dynamic>>[
ColumnSeries<ChartData, dynamic>(
dataSource: chartData,
xValueMapper: (ChartData data, _) => data.xValue,
yValueMapper: (ChartData data, _) => data.yValue)
],
));
}
return widget;
},
));
}
class ChartData {
ChartData({this.xValue, this.yValue});
ChartData.fromMap(Map<String, dynamic> dataMap)
: xValue = dataMap['x'],
yValue = dataMap['y'];
final Timestamp xValue;
final int yValue;
}
|
And our data structure in firebase is like below.
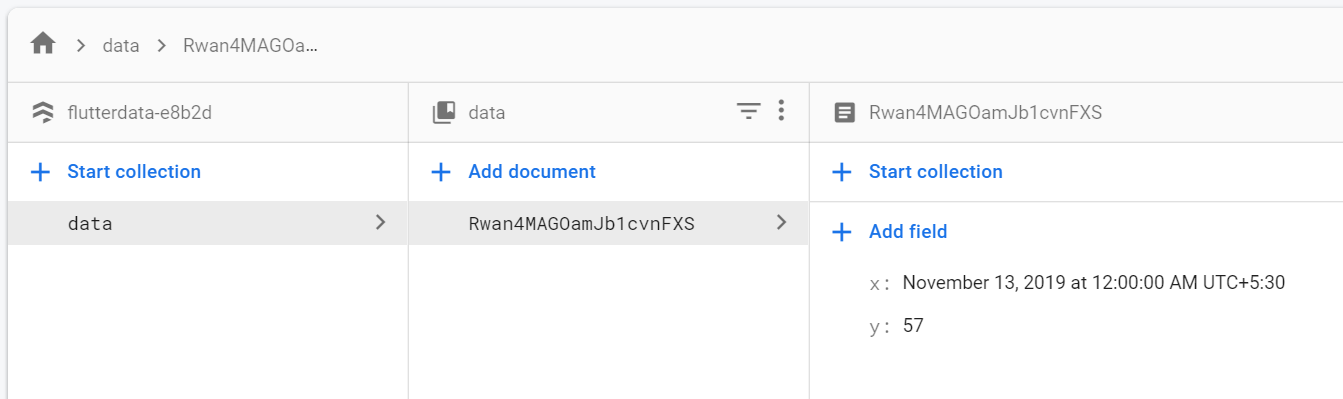
Screenshot:
For your convenience we have attached the sample which can be found be below.
Thanks,
Dharani.
SIGN IN To post a reply.
- 1 Reply
- 2 Participants
-
TR Trevor
- Nov 17, 2019 10:26 PM UTC
- Nov 18, 2019 01:50 PM UTC
