- Home
- Forum
- Angular - EJ 2
- Issue with Stock Chart
Issue with Stock Chart
Hi guys,


Best regards,
Attachment: Response_e9cc4aed.zip
I have a some issues with the Stock chart, im trying to copy the functions on the live demo, but i can't:
That's my stock chart config :
<div class="row">
<div class="col-12">
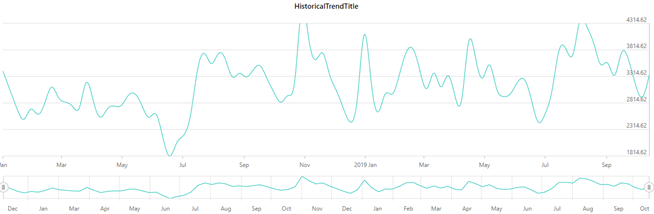
<ejs-stockchart id="chart-container" [enablePeriodSelector]='enable' [primaryXAxis]='primaryXAxis'[primaryYAxis]='primaryYAxis' [title]='HistoricalTrendTitle' [crosshair]='crosshair' style="display:block;" width="100%">
<e-stockchart-series-collection>
<e-stockchart-series [dataSource]='FeeDetail.HistoricalTrend' type='Spline' xName='RPT_RUN_DT' yName='FEE_TGT_AMT' name='India' width=2></e-stockchart-series>
</e-stockchart-series-collection>
</ejs-stockchart>
</div>
</div>
That's the value of my objects:
this.primaryXAxis = {
valueType: 'DateTime',
crosshairTooltip: {enable: true}
};
this.primaryYAxis = {
labelFormat: 'n2', minimum: minvalue, maximum: maxvalue,
majorTickLines: { color: 'transparent', width: 0 },
crosshairTooltip: {enable: true}
};
this.crosshair = {
enable: true
};
I got this chart:
1.- I'm trying to set the chart to width: 100%, but i can't get this size, the chart always show me in this size ( 40-45 %).
2.- When i move the period selector like this way:
I lost a lot of values and i lost the Y axis label too.
And when i'm trying to put back the period selector, i can't get the chart before i move the period selector:
The chart just show me the values of 2018, but i don't know why i can't see the 2019 values too and the Y axis labels just disappear.
I have attached the file i am working with.
Best regards,
Attachment: Response_e9cc4aed.zip
SIGN IN To post a reply.
3 Replies
SM
Srihari Muthukaruppan
Syncfusion Team
November 13, 2019 11:24 AM UTC
Hi Kevin,
We have analyzed your query. From that, we would like to let you know that the chart is responsive with respect to the width and height of its parent element, if its zero, then it will render with its default size(600 * 450). So please check with the parent element size. We have tried to replicate the reported issues by using data provided. Unfortunately, we are unable to reproduce the reported issues in EJ2. We have also attached the sample used by testing.
Screenshot:
We suspect this issue is because of size for parent of chart is zero, so check the parent element. If still your issue is reproduced. Please share the following information which will be more helpful for further analysis and provide you the solution sooner.
- Try to reproduce the reported scenario in the above sample
- Please share your sample (or) code snippet with full configurations.
- Share the details if you have done any other customization in your sample.
- Share your dataSource file
Let us know if you have any concerns.
Regards
Srihari M
KE
Kevin
November 13, 2019 10:45 PM UTC
Hi Srihari,
Really thanks for your time, i'm trying to put the chart inside of a modal- popup so that's the problem, so i'm going to play with the style of the modal.
If this post have a some status, please close this post.
Best regards,
SS
Sarasilmiya Shahul Hameed
Syncfusion Team
November 14, 2019 05:56 AM UTC
Hi Kevin,
Thanks for the update. Please get back to us if you need further assistance.
Regards,
Sara
SIGN IN To post a reply.
- 3 Replies
- 3 Participants
-
KE Kevin
- Nov 12, 2019 02:59 PM UTC
- Nov 14, 2019 05:56 AM UTC
