Y is displayed differently (w/ and w/o time portion).
@using Syncfusion.EJ2.Blazor.Charts
DataSource="@GetData1()" XName="X" YName="Y" Type="ChartSeriesType.Line">
DataSource="@GetData2()" XName="X" YName="Y" Type="ChartSeriesType.Line">
Position="LegendPosition.Bottom">
DataSource="@GetData3()" XName="X" YName="Y" Type="ChartSeriesType.Line">
Position="LegendPosition.Bottom">
@code{
public class ChartData
{
public DateTime X;
public int Y;
}
public List GetData1()
{
return new List()
{
new ChartData { X = new DateTime(2019,11,5), Y = 279},
new ChartData { X = new DateTime(2019,11,15), Y = 32},
new ChartData { X = new DateTime(2019,11,20), Y = 216},
new ChartData { X = new DateTime(2019,11,23), Y = 71},
new ChartData { X = new DateTime(2019,11,25), Y = 69}
};
}
public List GetData2()
{
return new List()
{
new ChartData { X = new DateTime(2019,11,5), Y = 88},
new ChartData { X = new DateTime(2019,11,15), Y = 16},
new ChartData { X = new DateTime(2019,11,20), Y = 72},
new ChartData { X = new DateTime(2019,11,23), Y = 23},
new ChartData { X = new DateTime(2019,11,25), Y = 21}
};
}
public List GetData3()
{
return new List()
{
new ChartData { X = new DateTime(2019,11,5), Y = 310},
new ChartData { X = new DateTime(2019,11,15), Y = 33},
new ChartData { X = new DateTime(2019,11,20), Y = 226},
new ChartData { X = new DateTime(2019,11,23), Y = 76},
new ChartData { X = new DateTime(2019,11,25), Y = 78},
new ChartData { X = new DateTime(2019,11,01), Y = 1}
};
}
public List GetData4()
{
return new List()
{
new ChartData { X = new DateTime(2019,11,5), Y = 88},
new ChartData { X = new DateTime(2019,11,15), Y = 16},
new ChartData { X = new DateTime(2019,11,20), Y = 72},
new ChartData { X = new DateTime(2019,11,23), Y = 23},
new ChartData { X = new DateTime(2019,11,25), Y = 21}
};
}
}
<chartseries name="first" <="" div="">
<chartseries name="second" <="" div="">
<chartlegendsettings visible="true" togglevisibility="true" <="" div="">
<chartseries name="wrong" <="" div="">
Hi everyone!
In my example I have the 1st chart is OK for me and it has Y shown as date w/o time
In my example I have the 1st chart is OK for me and it has Y shown as date w/o time
And for some reason for the second chart Y displayed with time portion.
Can I control that behaviour ?
SIGN IN To post a reply.
2 Replies
DC
Dan Cheremisinov
November 7, 2019 05:27 PM UTC
SM
Srihari Muthukaruppan
Syncfusion Team
November 8, 2019 08:43 AM UTC
Hi Dan,
Greetings from syncfusion.
We have analyzed your query. From that, we would like to let you know that, we can achieve your requirement using “labelFormat” property in primaryXAxis of chart. Based on that we have prepared a sample for your reference. Please find the below sample and code snippet.
Code Snippet:
|
<EjsChart Width="84%">
<ChartPrimaryXAxis ValueType="Syncfusion.EJ2.Blazor.Charts.ValueType.DateTimeCategory" LabelFormat="M/d/y"></ChartPrimaryXAxis>
<ChartPrimaryYAxis RangePadding="ChartRangePadding.Round">
</ChartPrimaryYAxis>
<ChartSeriesCollection>
<ChartSeries Name="wrong"
DataSource="@GetData3()" XName="X" YName="Y" Type="ChartSeriesType.Line">
<ChartMarker>
<ChartDataLabel Visible="true"></ChartDataLabel>
</ChartMarker>
</ChartSeries>
</ChartSeriesCollection>
<ChartLegendSettings Visible="true" ToggleVisibility="true"
Position="LegendPosition.Bottom"></ChartLegendSettings>
</EjsChart> |
Sample: https://www.syncfusion.com/downloads/support/directtrac/general/ze/LabelFormat-635471358.zip
Screenshot:
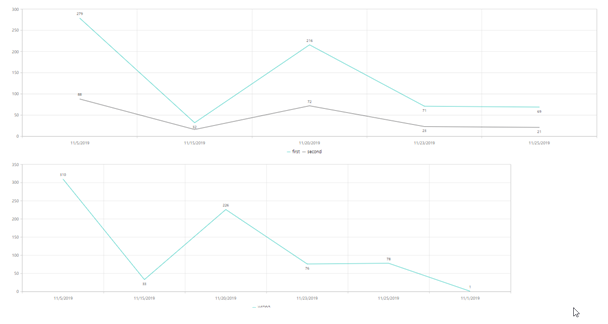
Let us know if you have any concerns.
Regards
Srihari M
SIGN IN To post a reply.
- 2 Replies
- 2 Participants
-
DC Dan Cheremisinov
- Nov 7, 2019 05:06 PM UTC
- Nov 8, 2019 08:43 AM UTC
