- Home
- Forum
- Angular - EJ 2
- Axes in polar chart not positioned correctly
Axes in polar chart not positioned correctly
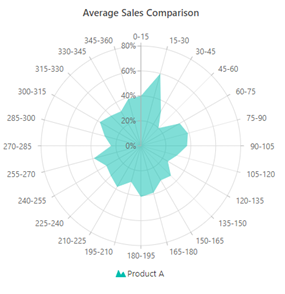
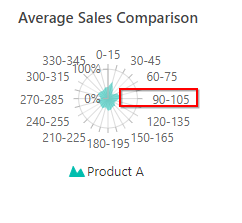
I have a polar chart, which if rendered at a smaller size, the labels aren't positioned correctly. The data source has 24 items, so should fit nicely into the 360degree circle (15degs each). But the x-axis labels are off. I would expect the 90deg-105deg to be completely horizontal pointing to the right (matching the pie segments).

If I render this larger, then it works nicely - ie. 90deg is completely horizontal pointing to the right. Although, perhaps showing too many labels here.

Any ideas why this is happening? I'm perhaps misunderstanding how this works - unfortunately, the documentation isn't great.
Thanks,
Dan
SIGN IN To post a reply.
9 Replies
SM
Srihari Muthukaruppan
Syncfusion Team
November 4, 2019 10:23 AM UTC
Hi Dan,
Greetings from Syncfusion.
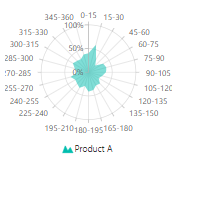
We have analyzed your query. From that, we have tried to replicate the reported scenario at our end. Unfortunately, we are unable to reproduce the reported issue. We have prepared a simple sample for your reference. In that, while reducing the chart height and width the x axis labels are placed in correct position and is working fine. Please find below sample and screenshot
Screenshot:
|
100% width |
reduced width |
 |
 |
Since we are not aware of your exact scenario which the issue is reproduced. So Please share the following information which will be more helpful for further analysis and provide you the solution sooner.
- Try to reproduce the reported scenario in the above sample
- Please share your sample (or) code snippet with full configurations.
- Share the details if you have done any other customization in your sample.
- Share your dataSource file
- Share the type of axis(Category or numeric)
Regards,
Srihari M.
DC
Dan Clarke
November 8, 2019 12:32 PM UTC
What's the difference between your "ejs-chart", and the "ej-chart" that I'm using? I assume that it's a newer version? These are the npm versions I'm currently using...
"dependencies": {
  "@angular/animations": "^5.2.11",
  "@angular/common": "^5.2.11",
  "@angular/compiler": "^5.2.11",
  "@angular/core": "^5.2.11",
  "@angular/forms": "^5.2.11",
  "@angular/http": "^5.2.11",
  "@angular/platform-browser": "^5.2.11",
  "@angular/platform-browser-dynamic": "^5.2.11",
  "@angular/platform-server": "^5.2.11",
  "@angular/router": "^5.2.11",
  "@nguniversal/module-map-ngfactory-loader": "^5.0.0",
  "@syncfusion/ej2-layouts": "^16.3.30",
  "angular-auth-oidc-client": "^4.1.0",
  "angular2-notifications": "0.7.0",
  "aspnet-prerendering": "^3.0.1",
  "auth0-js": "^9.8.1",
  "bootstrap": "^3.3.7",
  "core-js": "^2.5.7",
  "ej-angular2": "^16.3.21",
  "rxjs": "^5.5.12",
  "syncfusion-javascript": "^16.3.29",
  "zone.js": "^0.8.26"
},
"devDependencies": {
  "@angular/cli": "~1.7.4",
  "@angular/compiler-cli": "^5.2.11",
  "@angular/language-service": "^5.2.11",
  "@types/ej.web.all": "^16.3.1",
  "@types/jasmine": "^2.8.9",
  "@types/jasminewd2": "^2.0.5",
  "@types/jquery": "^3.3.22",
  "@types/node": "^6.14.1",
  "codelyzer": "^4.5.0",
  "jasmine-core": "~2.8.0",
  "jasmine-spec-reporter": "~4.2.1",
  "karma": "^2.0.5",
  "karma-chrome-launcher": "~2.2.0",
  "karma-coverage-istanbul-reporter": "^1.4.3",
  "karma-jasmine": "^1.1.2",
  "karma-jasmine-html-reporter": "^0.2.2",
  "protractor": "~5.1.2",
  "ts-node": "~4.1.0",
  "tslint": "~5.9.1",
  "typescript": "~2.5.3"
},
I can't replicate the issue in your version - however, I'm also having trouble upgrading my project to the latest Angular/Syncfusion - lots of errors. Seems a bit overkill to upgrade just because of this polar chart issue though. Do you know if this issue was something that has been fixed since the version I'm using?
SM
Srihari Muthukaruppan
Syncfusion Team
November 12, 2019 10:46 AM UTC
Hi Dan,
We have analyzed your query. From that, we would like to let you know that, “ejs-chart” is the updated version of ej-chart and it’s a typescript based angular component. Hence we suggest you to use ejs-chart instead of ej-chart. We have also prepared a sample with updated package for your reference. In that the polar chart is working fine even for smaller size. Please find the below sample and screenshot for reference.
Screenshot:
Let us know if you have any concerns or need any further assistance.
Regards
Srihari M
DC
Dan Clarke
December 20, 2019 12:14 PM UTC
Hi. I'm struggling to include ejs-chart in my project that uses other EJ1 components. Looking at this forum post, you suggest that this is possible. However, when I try it, I get the following error...

Doing a Google, I found this forum post, where you say you can't mix and match EJ1 and EJ2 - so seems to contradict the other above-mentioned forum post.
I don't want to have to re-write the entire website to use EJ2 components.
Could you describe how to either use the EJ2 chart component in an EJ1 Angular project, or how to fix the EJ1 polar chart rendering issue?
Thanks again for your help with this,
Kind Regards,
Dan
DG
Durga Gopalakrishnan
Syncfusion Team
December 24, 2019 05:26 AM UTC
Hi Dan,
We have analyzed your query. Similar component from EJ1 and EJ2 platform cannot be used together. You need to choose the component in either EJ1 or EJ2 platform. We have prepared sample to render EJ2 chart and EJ1 Gantt in EJ1 angular project, based on your requirement. Please find the sample and code snippet.
Code snippet
|
firstcomponent.ts
import { ChartComponent } from '@syncfusion/ej2-angular-charts';
@Component({
template: `<ejs-chart>
//…
</ejs-chart>`
})
app.module.ts
import { ChartAllModule } from '@syncfusion/ej2-angular-charts';
@NgModule({
imports: [
ChartAllModule
],
package.json
"dependencies": {
"@syncfusion/ej2-angular-charts": "^17.4.39",
} |
Screenshot
Sample
Kindly revert us, if you have any concerns.
Regards,
Durga
DC
Dan Clarke
January 3, 2020 10:26 AM UTC
Hi,


Thanks again for your help,
Thank you for your example. Unfortunately, when I try to add that to my project, I get this error in the Chrome devtools window...
Line 143 refers to the line with the element...
Any ideas? I've included all the bits you mentioned in your last post.
Thanks again for your help,
Dan
SM
Srihari Muthukaruppan
Syncfusion Team
January 6, 2020 04:58 AM UTC
Hi Dan,
We have validated with our end and we suspect that you are injecting both EJ1 and EJ2 modules in same application. It is not possible to use both EJ1 and EJ2 Chart in same application as they results in selector conflicts. We suggest you to remove the EJ1 Modules from the app.module.ts to resolve the reported problem.
Code Example:
[app.module.ts]
|
@NgModule({
...
imports: [
BrowserModule,
// EJAngular2Module.forRoot(), remove EJ1 modules
ChartModule,
ButtonModule
],
...
})
|
We have also attached the documentation link for your reference. Please find below UG link.
Regards,
Srihari M.
DC
Dan Clarke
January 10, 2020 09:49 AM UTC
Hi. Thank you for your reply. If I remove that import line, then I get lots of other errors. Eg. "ReferenceError: ej is not defined". Note that I'm not trying to use both EJ1 and EJ2 *Charts*. The main other control I'm using is the Grid, which is EJ1. Presumably, the import line you said to remove is including *all* the EJ1 controls - so as well as removing that line, I also need to add in other more granular EJ1 imports for both "ej" and "ej-grid"? Do you know what these includes are?
Thanks,
Dan
SM
Srihari Muthukaruppan
Syncfusion Team
January 13, 2020 11:40 AM UTC
Hi Dan,
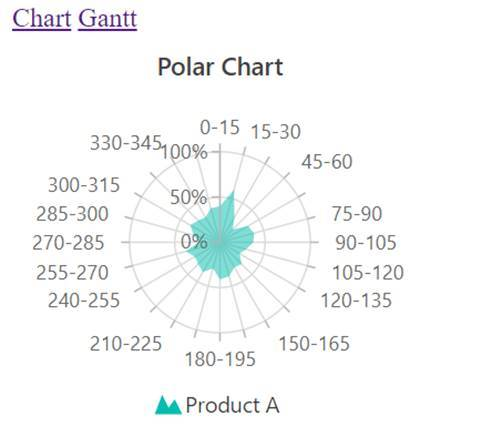
We have analyzed your query. From that, we would like to let you know that we can achieve your requirement by importing “EJ_GRID_COMPONENTS” from ej2-angular package as mentioned in the code snippet. Based on your requirement we have prepared a sample for your reference. In which Grid sample has been rendered in EJ1 and place under the Grid tab and chart has been rendered in EJ2 and placed under chart tab. Please find the below sample, code snippet and screenshot.
Sample: https://www.syncfusion.com/downloads/support/directtrac/general/ze/EJ1Grid_EJ2Chart991782852.zip
Code Snippet:
|
import { NgModule } from '@angular/core';
import { CommonModule } from '@angular/common';
import { BrowserModule } from '@angular/platform-browser';
import { ToolbarModule } from '@syncfusion/ej2-angular-navigations';
import { ChartAllModule } from '@syncfusion/ej2-angular-charts';
import { DateTimePickerModule } from '@syncfusion/ej2-angular-calendars';
import { AppComponent } from './app.component';
import { FirstComponent } from './first.component';
import { SecondComponent } from './second.component';
import { RouterModule, Routes } from '@angular/router';
import { EJ_GRID_COMPONENTS } from 'ej-angular2/src/ej/grid.component';
const appRoutes: Routes = [
{ path: 'first', component: FirstComponent },
{ path: 'second', component: SecondComponent },
{
path: '',
redirectTo: '/first',
pathMatch: 'full'
}
];
@NgModule({
imports: [
BrowserModule,
GridModule,
ChartAllModule,
ToolbarModule,
CommonModule,
DateTimePickerModule,
RouterModule.forRoot(
appRoutes,
{ useHash: true })
],
declarations: [AppComponent, FirstComponent, EJ_GRID_COMPONENTS, SecondComponent],
bootstrap: [AppComponent],
providers: [GroupService, EditService, FilterService, PageService, SortService, ToolbarService]
})
export class AppModule { } |
Screenshot:


Let us know if you have any concerns.
Regards,
Srihari M
SIGN IN To post a reply.
- 9 Replies
- 3 Participants
-
DC Dan Clarke
- Nov 1, 2019 12:31 PM UTC
- Jan 13, 2020 11:40 AM UTC
