- Home
- Forum
- Xamarin.Forms
- DataMaker show outside SfChart (Pie Series)
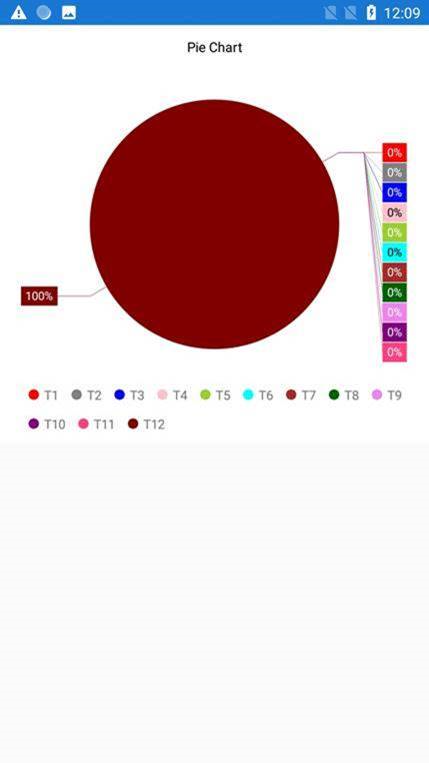
DataMaker show outside SfChart (Pie Series)
When I have many XPath with value 0. The SfChart show DataMaker outside the Frame. And background Datamaker same between of T1 and T11 , T2 and T12. How to fix it?
This my code:
DataMarkerPosition = CircularSeriesDataMarkerPosition.OutsideExtended;
DataMarkerPosition = CircularSeriesDataMarkerPosition.OutsideExtended;
EnableSmartLabels = true;
SIGN IN To post a reply.
3 Replies
HM
Hemalatha Marikumar
Syncfusion Team
October 15, 2019 08:48 AM UTC
Hi Nguyen Khoa Lu,
Greetings from Syncfusion.
Query 1: The SfChart show DataMarker outside the Frame.
Greetings from Syncfusion.
Query 1: The SfChart show DataMarker outside the Frame.
Due to the lack of space in PieSeries, DataMarker goes out of the frame. You can resolve this issue by setting the StartAngle and EndAngle properties in PieSeries.
Please refer below code snippet.
Code Snippet [Xaml]:
|
<chart:SfChart.Series>
<chart:PieSeries StartAngle="330" EndAngle="690" ItemsSource="{Binding Data}" XBindingPath="XValue" YBindingPath="YValue"
EnableSmartLabels="True" ConnectorLineType="Line"
DataMarkerPosition="OutsideExtended" ShowMarkerAtLineEnd="True">
</chart:PieSeries>
</chart:SfChart.Series> |
Query 2: And background Datamarker same between of T1 and T11 , T2 and T12.
We have provided only ten colors in source level, so the same colors will repeat it when the datapoint is more than ten. You can resolve this issue by setting the CustomBrushes in ChartSeries.
Please refer below code snippet.
Code Snippet [Xaml]:
|
<StackLayout.Resources>
<ResourceDictionary>
<chart:ChartColorCollection x:Key="Colors">
<Color>Red</Color>
<Color>Gray</Color>
<Color>Blue</Color>
<Color>Pink</Color>
<Color>YellowGreen</Color>
<Color>Aqua</Color>
<Color>Brown</Color>
<Color>DarkGreen</Color>
<Color>Violet</Color>
<Color>Purple</Color>
<Color>Accent</Color>
<Color>Maroon</Color>
<Color>Lavender</Color>
<Color>Navy</Color>
</chart:ChartColorCollection>
</ResourceDictionary>
</StackLayout.Resources>
<chart:SfChart.Series>
<chart:PieSeries StartAngle="330" EndAngle="690" ItemsSource="{Binding Data}" XBindingPath="XValue" YBindingPath="YValue"
EnableSmartLabels="True" ConnectorLineType="Line"
DataMarkerPosition="OutsideExtended" ShowMarkerAtLineEnd="True">
<chart:PieSeries.ColorModel>
<chart:ChartColorModel Palette="Custom" CustomBrushes="{StaticResource Colors}"/>
</chart:PieSeries.ColorModel>
</chart:PieSeries>
</chart:SfChart.Series> |
Please refer below link to know more about the CustomBrushes.
And we have prepared a sample based on your requirement and you can download the sample from the below link.
Screenshot:
Regards,
Hemalatha M.
NK
Nguyen Khoa Lu
October 16, 2019 07:27 AM UTC
Thanks you. I did it!
HM
Hemalatha Marikumar
Syncfusion Team
October 17, 2019 09:46 AM UTC
Hi Nguyen Khoa Lu,
Thanks for your update. We glad to hear that given solution works.
Please let us know if you have any other query.
Regards,
Hemalatha M.
SIGN IN To post a reply.
- 3 Replies
- 2 Participants
-
NK Nguyen Khoa Lu
- Oct 15, 2019 01:26 AM UTC
- Oct 17, 2019 09:46 AM UTC
