Hi Martin,
Greetings from syncfusion
We have validated your query. From that, we would like to let you know that, currently we can export the chart rendered as image to the PDF using “export” method available in export module, in which “PDF” format and file name can be passed as an arguments. Based on that we have prepared a sample and also provided the code snippet for your reference.
Code Snippet:
[index.cshtml]:
|
<div class="control-section col-lg-9" align="center">
<ejs-chart id="container" >
<e-chart-primaryxaxis valueType="Category" title="Countries"></e-chart-primaryxaxis>
<e-series-collection>
<e-series dataSource="ViewBag.dataSource" xName="xValue" yName="yValue" type="@Syncfusion.EJ2.Charts.ChartSeriesType.Column">
</e-series>
</e-series-collection>
</ejs-chart>
</div>
<script>
document.getElementById('button').onclick = () => {
var chart = document.getElementById('container').ej2_instances[0];
chart.exportModule.export("PDF", 'chart');
};
</script> |
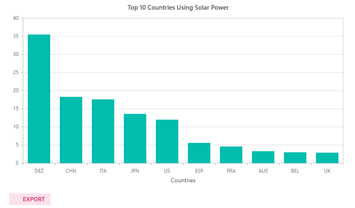
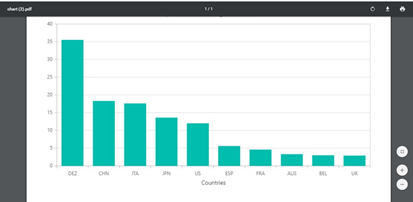
Screenshot:
Please let me know, if you have any concerns.
Regards,
Srihari