- Home
- Forum
- ASP.NET MVC - EJ 2
- adding custom comment into my tooltip that I get from my database
adding custom comment into my tooltip that I get from my database
Hey currently I have my tooltip display the x and y values when I hover over a point. I am wanting to display a comment on the tooltip that I get from the database while gathering the data for the chart? I'm a little confused on how to accomplish this, any help would be appreciated.
Here is what my cshtml looks like:
@Html.EJS().Chart("stdDevAsic").PrimaryXAxis(px => px.Title("Image Number").
ValueType(Syncfusion.EJ2.Charts.ValueType.Category)).Series(series =>
{
for (var i = 0; i < countAsic; i++)
{
series.Type(
Syncfusion.EJ2.Charts.ChartSeriesType.Line
).DataSource(ViewBag.StandardDeviationAsic[i]).Name(ViewBag.AsicNames[i]).XName("ImageNumber").YName("Value").Add();
}
}
).PrimaryYAxis(py => py.Title("Value")).Title("Standard Deviation of Asics").Tooltip(tt => tt.Enable(true)).ZoomSettings(z => z.EnableMouseWheelZooming(true)).Render()
Then my class looks like this:
public class ChartData
{
public double Value;
public int ImageNumber;
}
Thank you
SIGN IN To post a reply.
3 Replies
BV
Bhuvanesh Valarman
Syncfusion Team
September 13, 2019 02:34 PM UTC
Hi Gideon,
Greetings from Syncfusion.
We have analyzed your query. From that we suggest you to use the following code snippet to achieve your requirement.
Please find the code snippet below. In that we have used “TooltipRender” event to customize the tooltip text with comments.
Code Snippet:
|
@Html.EJS().Chart("container").Series(series =>
{
series.Type(Syncfusion.EJ2.Charts.ChartSeriesType.Line).Width(2).XName("x")
.Marker(mr => mr.Visible(true).Width(10).Height(10)).YName("yValue")
.DataSource(ViewBag.dataSource).Add();
}).PrimaryXAxis(px => px.ValueType(Syncfusion.EJ2.Charts.ValueType.Category)
).Tooltip(tt => tt.Enable(true)).TooltipRender("tooltipRender").Render()
<script>
function tooltipRender(args) {
// You can add your comments in args.text to display in tooltip
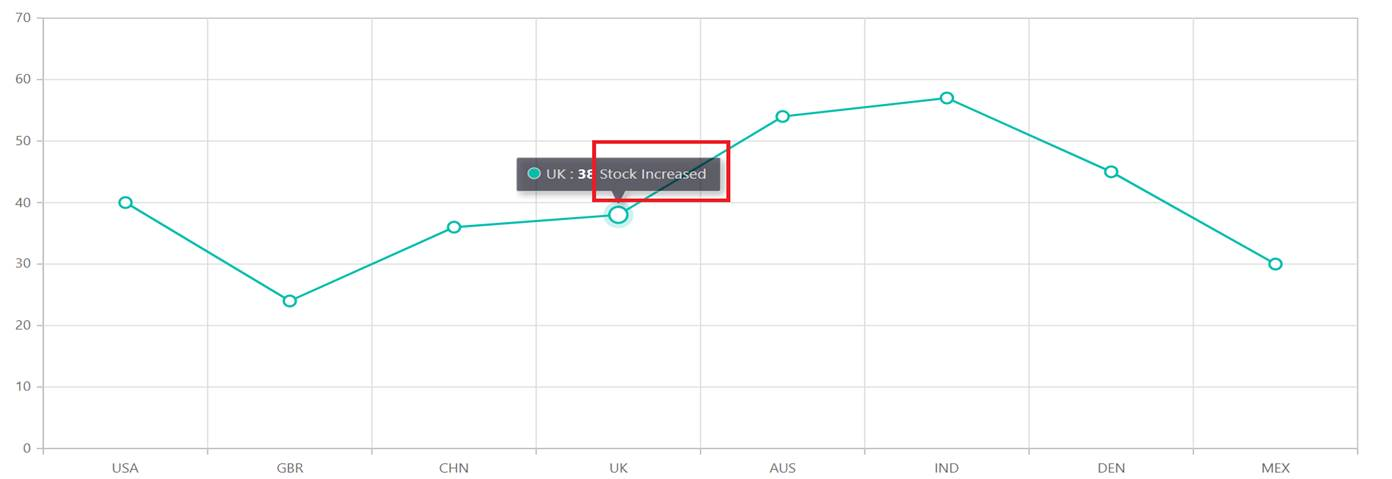
args.text += " Stock Increased";
}
</script> |
Screenshot:
 |
Kindly revert us, if this is not your requirement.
Regards,
Bhuvanesh V.
GK
Gideon Keys
September 13, 2019 04:45 PM UTC
Ok I see how to do that. But in my website the comments are saved in the database and I have them when I am putting my data into the charts. Is there a way to achieve this in the c# backend code?
KC
Kalaimathi Chellaiah
Syncfusion Team
September 16, 2019 11:36 AM UTC
Hi Gideon,
Thanks for the update.
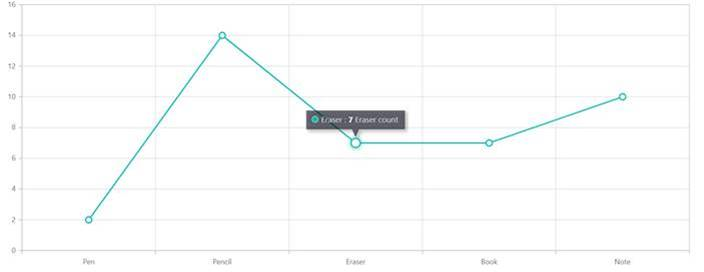
We have analyzed your query. We can achieve your requirement by getting the text from dataSource and mapping it into the view page using TooltipMappingName property of the series. Then we can access this text using args.point.tooltip in tooltip render event. In this case tooltip text is showing properly based on custom text which is passed from code behind. We have prepared a simple sample for your reference and please make these changes at your end based on your scenario. Please find below,
Code Snippet:
|
[Index.cshtml]:
@Html.EJS().Chart("container").Series(series =>
{
series.Type(Syncfusion.EJ2.Charts.ChartSeriesType.Line).Width(2).XName("x")
.Marker(mr => mr.Visible(true).Width(10).Height(10)).TooltipMappingName("text").YName("y")
.DataSource(ViewBag.dataSource).Add();
}).PrimaryXAxis(px => px.ValueType(Syncfusion.EJ2.Charts.ValueType.Category)
).Tooltip(tt => tt.Enable(true)).TooltipRender("tooltipRender").Render()
<script>
function tooltipRender(args) {
// You can add your comments in args.text to display in tooltip
args.text += " " + args.point.tooltip;
}
</script>
[HomeContoller.cs]:
public ActionResult Index()
{
List<DoubleData> chartData = new List<DoubleData>
{
new DoubleData { x = "Pen", y = 2, text="Pen count"},
new DoubleData { x = "Pencil", y = 14, text="pencil count" },
new DoubleData { x = "Eraser", y = 7, text="Eraser count" },
new DoubleData { x = "Book", y = 7, text="Book count" },
new DoubleData { x = "Note", y = 10, text="Note count" },
};
ViewBag.dataSource = chartData;
return View();
}
public class DoubleData
{
public string x;
public double y;
public string text;
} |
Screenshot:
Kindly check the above sample and revert us, if this is not your exact requirement.
Regards,
Kalai.
SIGN IN To post a reply.
- 3 Replies
- 3 Participants
-
GK Gideon Keys
- Sep 12, 2019 08:20 PM UTC
- Sep 16, 2019 11:36 AM UTC
