Chart Series not correctly updating when adding a new series
Hello, I get an error when adding a new series to my chart. I am trying to create a chart with candlesticks and various custom indicators. Indicators is a list that gets added to after a user clicks a button. See the following code below:
<EjsChart @ref:suppressField @ref="@chart" Title="@(Request.Instrument + " Chart")">
<ChartPrimaryXAxis ValueType="Syncfusion.EJ2.Blazor.Charts.ValueType.DateTimeCategory">
</ChartPrimaryXAxis>
<ChartZoomSettings EnableMouseWheelZooming="true" EnablePinchZooming="true" EnableSelectionZooming="true" EnableScrollbar="true"></ChartZoomSettings>
<ChartTooltipSettings Enable="true"></ChartTooltipSettings>
<ChartSeriesCollection>
<ChartSeries DataSource="@Candles.candles" Type="ChartSeriesType.Candle" EnableSolidCandles="true" XName="time" Volume="volume" High="High" Low="Low" Open="Open" Close="Close">
</ChartSeries>
@foreach (var indicator in Indicators)
{
<ChartSeries @key="@indicator" DataSource="@indicator.Outputs.ToList()" XName="Key" YName="Value"
Type="ChartSeriesType.Line">
</ChartSeries>
}
</ChartSeriesCollection>
</EjsChart>
It tries to add it, when I look at chart-series.js SeriesBase.prototype.dataPoint method, the currentViewData is correct for the new row. However, it's claiming that XName is not set for the ChartSeries, so I am thinking there's something wrong w/ the binding.
Also I tried adding something to the list prior to creating the chart and it worked fine. It seems like it's only when adding a series to an existing chart.
Any help is appreciated. Thanks!
SIGN IN To post a reply.
23 Replies
KM
Kesavan Muthusamy
Syncfusion Team
September 3, 2019 09:51 AM UTC
Hi Dan,
Greetings from Syncfusion.
We have analyzed your query. Based on your requirement we have a prepared a simple sample .
Please find the following code snippet:
Code snippet:
|
<EjsChart>
<ChartPrimaryXAxis ValueType="Syncfusion.EJ2.Blazor.Charts.ValueType.DateTime"></ChartPrimaryXAxis>
<ChartSeriesCollection>
<ChartSeries DataSource="IndicatorData[0].Outputs" XName="@nameof(ChartData.XValue)" YName="@nameof(ChartData.YValue)" Type="ChartSeriesType.Column"></ChartSeries>
@foreach (var indicator in IndicatorData)
{
<ChartSeries DataSource="indicator.Outputs" XName="@nameof(ChartData.XValue)" YName="@nameof(ChartData.YValue)"></ChartSeries>
}
</ChartSeriesCollection>
</EjsChart>
@code{
public class ChartData
{
public DateTime XValue { get; set; }
public double YValue { get; set; }
}
public class Indicator
{
public string value { get; set; }
public List<ChartData> Outputs { get; set; }
}
} |
Sample link : https://www.syncfusion.com/downloads/support/forum/147090/ze/MultipleSeries898764379
Please let us know if you have any queries.
Regards,
Kesavan
DB
Dan Borgen
September 3, 2019 05:56 PM UTC
Thank you for your quick response. However, this does not solve the problem. The problem is when you add another series to the chart after the chart is already made. I updated the Index.razor file you sent me in your demo to be able to add a series after the chart is created, so I hope the issue is clear. Please try running this code and click the "Add Indicator" button. For me the chart breaks and I get a javascript error. Let me know if it's not clear. Thanks!
Attachment: MultipleSeries_51962db2.zip
Attachment: MultipleSeries_51962db2.zip
KM
Kesavan Muthusamy
Syncfusion Team
September 9, 2019 09:53 AM UTC
Hi Dan,
Sorry for the inconvenience.
We have analyzed your query and we are able to replicate the reported issue from our side. So, we have logged a feedback for the issue and the fix for the issue will be available for 2019 volume 3 release, which is expected to be roll out at the end of September.
Feedback link - https://www.syncfusion.com/feedback/8735/
If you have any more specification/precise replication procedure or a scenario to be tested, you can add it as a comment in the portal.
Please let us know if you have any concerns.
Regards,
Kesavan
SU
Support
October 22, 2019 11:13 PM UTC
Is this fixed and deployed?
Why have a public forum with private feedback links?
KM
Kesavan Muthusamy
Syncfusion Team
October 23, 2019 01:35 PM UTC
Hi Patrick,
Thanks for being patience.
Sorry for the inconvenience caused. we have added the fix for the reported issue in v17.3.19 and is available for download under the following link.
We have resolved your reported issue in our latest Blazor package release. You can use the latest (17.3.0.19-beta) Syncfusion.EJ2.Blazor NuGet package version and updated interop CDN file to get rid of the reported issue.
CDN Link for Interop file: https://cdn.syncfusion.com/ej2/17.3.19/dist/ejs.interop.min.js
Screenshot:
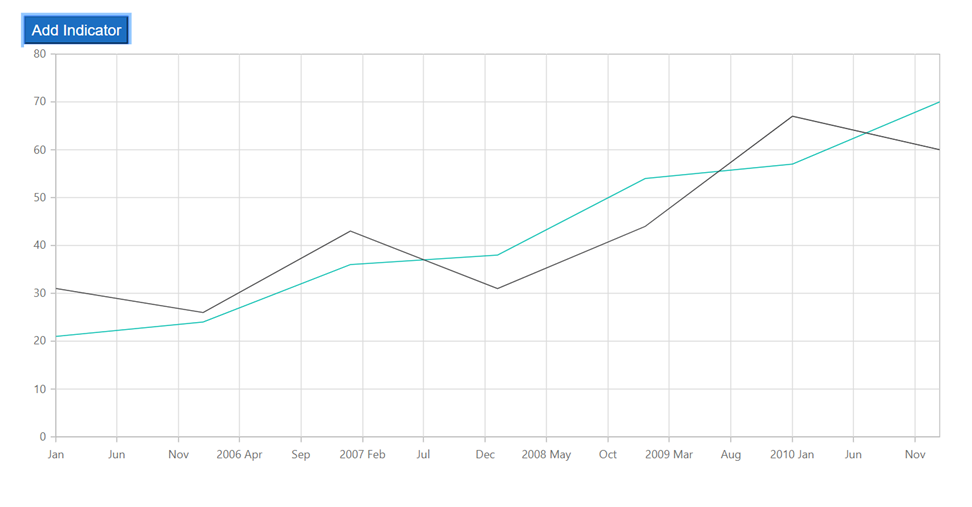
We thank you for your support and appreciate your patience in waiting for this release. Please get in touch with us if you would require any further assistance.
Regards,
Kesavan
DB
Dan Borgen
October 23, 2019 03:25 PM UTC
It seems to be working fine for me. Thanks for the fix. FYI for those using Web Assembly blazor, all I had to do was update the ej2.min.js to https://cdn.syncfusion.com/ej2/17.3.19/dist/ej2.min.js worked for me. I don't have an interop file referenced (maybe it's a server-side blazor thing?)
KM
Kesavan Muthusamy
Syncfusion Team
October 24, 2019 01:34 PM UTC
Hi Dan,
Thanks for the update.
We have analyzed your query. For web assembly application, it is not necessary to include ejs-interop.min.js since it will be referred from NuGet.
Please refer to the following link for getting started with web assembly and server App to render Syncfusion components.
Please let us know if you have any concerns about this.
Regards,
Kesavan
CH
Chriss
December 21, 2019 04:00 PM UTC
Using the latest version (17.4.39) this demo doesn't work for me. It'll render the initial line but won't add a second. Also if you're making an async call for data in OnInitializedAsync how do you get it to render additional chart series?
@foreach (var indicator in IndicatorData)
{
<ChartSeries DataSource="indicator.Outputs" XName="XValue" YName="YValue"></ChartSeries>
}
It never seems to render!
I can't find any examples of how charts that require dynamic series should be done, charts also seem to be missing from the documentation.
Help :-)
BV
Bhuvanesh Valarman
Syncfusion Team
December 23, 2019 12:55 PM UTC
Hi Chriss,
Sorry for the inconvenience cause.
We have analyzed your query. From that we can reproduce your reported issue. we are forwarding this issue to our internal team. We will update you once it get resolved until then we suggest you to use the below method to overcome your issue. We also resolved the chart missing in documentation, once it refreshed in online we will let you know.
We have used Chart AddSeries public method to add series on button click.
Code snippet:
|
....
<EjsChart @ref="ChartObj">
<ChartPrimaryXAxis ValueType="Syncfusion.EJ2.Blazor.Charts.ValueType.DateTime"></ChartPrimaryXAxis>
<ChartSeriesCollection>
@foreach (var indicator in IndicatorData)
{
<ChartSeries DataSource="indicator.Outputs" XName="XValue" YName="YValue"></ChartSeries>
}
</ChartSeriesCollection>
</EjsChart>
....
@code{
EjsChart ChartObj;
....
public void AddIndicator()
{
List<ChartSeries> seriesCollection = new List<ChartSeries>();
seriesCollection.Add(new ChartSeries
{
XName = "XValue",
YName = "YValue",
DataSource = new List<ChartData>
{
new ChartData { XValue = new DateTime(2005, 01, 01), YValue = 31 },
new ChartData { XValue = new DateTime(2006, 01, 01), YValue = 26 },
new ChartData { XValue = new DateTime(2007, 01, 01), YValue = 43 },
new ChartData { XValue = new DateTime(2008, 01, 01), YValue = 31 },
new ChartData { XValue = new DateTime(2009, 01, 01), YValue = 44 },
new ChartData { XValue = new DateTime(2010, 01, 01), YValue = 67 },
new ChartData { XValue = new DateTime(2011, 01, 01), YValue = 60 },
}
});
ChartObj.AddSeries(seriesCollection);
}
....
|
Kindly revert us, if you need further assistance.
Regards,
Bhuvanesh v.
SK
Suduk Kim
January 2, 2020 07:55 AM UTC
Hi, the sample code above seems to work for the line or area chart.
But it has problem when the chart series type is column (I did not try all the types).
Ultimately, I want to dynamically update the chart with different series type and variable number of series and x data.
Thanks in advance.
SM
Srihari Muthukaruppan
Syncfusion Team
January 6, 2020 05:32 AM UTC
Hi Suduk,
We have analyzed your query. We were able to reproduce the issue in your version and we confirm this as a bug and logged a defect report. You can keep track of the bug from the feedback portal below.
The fix will be available in our weekly patch release which is scheduled to be rolled out on or before January 07th, 2019.
If you have any more specification/precise replication procedure or a scenario to be tested, you can add it as a comment in the portal
Regards,
Srihari M
SM
Srihari Muthukaruppan
Syncfusion Team
January 7, 2020 01:48 PM UTC
Hi Suduk,
Sorry for the inconvenience.
Due to some technical issues, we are unable to include this fix in this patch release. So we will consider this issue in our upcoming weekly patch release which is expected to be rolled out at January 14th 2020. We appreciate your patience until then.
Thanks,
Srihari M
SM
Srihari Muthukaruppan
Syncfusion Team
January 15, 2020 12:15 PM UTC
Hi Suduk,
We have validated the reported issue and able to reproduce them. The root cause for the same is in JSON serialization so we need to analyze further on this. We will provide the fix for this in the patch release which is scheduled on last week of January, 2020. We appreciate your patience until then.
Let us know if you have any concern.
Regards,
Srihari M
SK
Suduk Kim
January 18, 2020 03:29 AM UTC
Thanks for the update.
Chart drawing is unstable after adding and removing series multiple times even for the line or area series type.
ClearSeries() function is desired to clear all the series rather than removing series on by one.
Regards
SM
Srihari Muthukaruppan
Syncfusion Team
January 22, 2020 12:01 PM UTC
Hi Suduk,
We have analyzed your query. From that we would like to let you know that as of now we are facing issues while adding and removing series and also while removing the whole series using for loop, so we have logged a defect report. You can keep track of the bug from the feedback portal below.
Feedback Link: https://www.syncfusion.com/feedback/8735/properties-did-not-bind-properly-when-values-updated-through-for-loop
The fix will be available in our weekly patch release which is scheduled to be rolled on February 5th , 2019.
If you have any more specification/precise replication procedure or a scenario to be tested, you can add it as a comment in the portal
Regards,
Srihari M
SM
Srihari Muthukaruppan
Syncfusion Team
February 6, 2020 05:50 PM UTC
Hi Suduk,
Sorry for the inconvenience.
Due to some technical issues, we are unable to include this fix in this patch release. So we will consider this issue in our weekly patch release which is expected to be rolled out at February 11th 2020. We appreciate your patience until then.
Thanks,
Srihari M
SM
Srihari Muthukaruppan
Syncfusion Team
February 12, 2020 03:58 AM UTC
Hi Suduk,
Sorry for the inconvenience caused.
We have fixed this issue at our end. Due to some technical difficulties we are unable to include this fix in our weekly release. Meanwhile, we will provide custom patch in reported release version on 12 February 2020. We appreciate your patience until then.
Regards,
Srihari.
SM
Srihari Muthukaruppan
Syncfusion Team
February 13, 2020 05:43 AM UTC
Hi Suduk,
Sorry for the inconvenience.
We are glad to announce that our v17.4.49 patch release is rolled out, we have added the fix for the mentioned issue . And you can use the latest (17.4.49) Syncfusion.EJ2.Blazor NuGet package version and updated interop CDN file to get rid of the reported issue.
We appreciate your patience in waiting for this release. Kindly Let us know, if you need further assistance.
Regards,
Srihari
SK
Suduk Kim
March 31, 2020 08:36 AM UTC
Hi,
Attachment: BlazorApp1_ea0efb90.zip
AddSeries and ClearSeries functions seem to work when ChartSeriesType is StackingArea.
But there is still problem if ChartSeriesType is Column or StackingColumn.
I tried the latest 18.1.36-beta.
This feature is critical for our application, so we worked on WPF application as temporary workaround.
That's why I have a chance to check the fix only now.
Syncfusion WPF chart component works really well.
I hope Blazor chart component matches the quality of WPF chart.
Regards
Attachment: BlazorApp1_ea0efb90.zip
DG
Durga Gopalakrishnan
Syncfusion Team
April 1, 2020 03:52 PM UTC
Hi Dan,
We are validating your reported scenario. We will update the status within one business day(2nd April, 2020). We appreciate your patience until then.
Regards,
Durga G
BP
Baby Palanidurai
Syncfusion Team
April 6, 2020 03:30 AM UTC
Hi Dan,
Thanks for your patience.
We are able to reproduce the reported issue and we will
validate and update you the status on 6th April, 2020. We appreciate
your patience until then.
Regards,
Baby.
SM
Srihari Muthukaruppan
Syncfusion Team
April 8, 2020 01:38 PM UTC
Hi Dan,
Sorry for the inconvenience.
We have analyzed your query. We were able to reproduce the issue and we confirm this as a bug and logged a defect report. You can keep track of the bug from the feedback portal below. We will provide a custom patch for the bug in the mentioned version on or before April 21st, 2020.
Feedback Portal: https://www.syncfusion.com/feedback/13279
Let us know if you have any concerns.
Regards
Srihari M
SM
Srihari Muthukaruppan
Syncfusion Team
April 22, 2020 05:40 AM UTC
Hi Dan,
Thanks for you patience.
We are glad to announce that our v18.1.45 patch release is rolled out, we have added the fix for the mentioned issue. And you can use the latest (18.1.45) Syncfusion.EJ2.Blazor NuGet package version and updated interop CDN file to get rid of the reported issue.
We appreciate your patience in waiting for this release. Kindly let us know if you need further assistance.
Regards,
Srihari
SIGN IN To post a reply.
- 23 Replies
- 9 Participants
-
DB Dan Borgen
- Aug 31, 2019 11:56 PM UTC
- Apr 22, 2020 05:40 AM UTC
