- Home
- Forum
- Angular - EJ 2
- Dynamic chart series with ngFor does not re-render.
Dynamic chart series with ngFor does not re-render.
<ejs-chart #chart id="chart-container"         ...>
   <e-series-collection>
      <e-series *ngFor="let chart of  chartData; let i = index"
              [dataSource]="chart.values"
              type='StackingColumn'
              xName="time"
              yName="value"
              [cornerRadius]='radius[i]'
              [name]="chart.name" [marker]="marker">
      </e-series>
   </e-series-collection>
</ejs-chart>
|
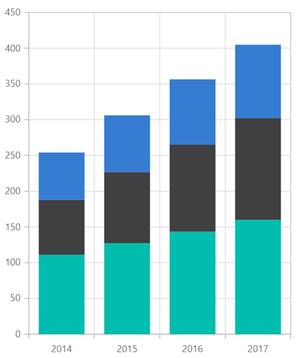
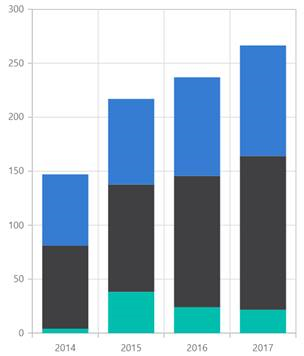
Initial Rendering |
After Button Click |
 |
 |
- Try to reproduce the reported scenario in the above sample
- Please share your sample (or) code snippet with full configurations.
- Share the details if you have done any other customization in your sample.
- Share your dataSource file
Thanks for your response.
It doesn't work if I re assign to chartData.
https://stackblitz.com/edit/angular-hehuvj-vftmxh
Hi team,
sample sample not working in latest packages
simply changed all packages to * in your sample
https://stackblitz.com/edit/angular-zzaiqi-q1uly4?file=package.json
Hi Kumaresan,
We are glad to announce that our Essential Studio 2022 Volume 1 SP release v20.1.0.55 is rolled out; we have added the fix for reported issue and is available for download under the following link.
Sample : https://stackblitz.com/edit/angular-39rf3t?file=app.component.html,app.component.ts
We thank you for your support and appreciate your patience in waiting for this release. Please get in touch with us if you would require any further assistance.
Regards,
Durga Gopalakrishnan.
Hi Team,
Facing issue with multi series line chart "Dynamic chart series with ngFor does not re-render". i have added series dynamically in dataSource but wile applying ngFor on <e-series></e-series> line chart is not rendered.
My e-series collection are as follows.
Hi Vinit,
We have analyzed your query, based on that we created a multiColoredLine chart by adding series dynamically in dataSource using ngFor for your reference.
Please find the sample , code-snippet, and screen-shot for your reference.
|
<e-series-collection> <e-series *ngFor="let chart of chartData;" [dataSource]="chart.values" type='MultiColoredLine' xName="x" yName="y" [segments]='segments' segmentAxis='Y' > </e-series> </e-series-collection> public segments: Object[] = [{ value: 2000, color: 'green' }, { color: 'blue' }]; |

If you are still facing problem, please try to replicate an issue in attached sample or share us issue reproduced sample so that it will be helpful to validate this case further. Kindly revert us if you have any concerns.
Regards,
Nishanthi
- 10 Replies
- 6 Participants
-
AR Akshay Rana
- Jul 31, 2019 12:08 PM UTC
- May 29, 2023 09:12 AM UTC
