Different colored markers
Hello:
Is it possible to show different colored markers on the same map? I can load several markers but all are rendered in red.
SIGN IN To post a reply.
4 Replies
BP
Baby Palanidurai
Syncfusion Team
July 22, 2019 09:48 AM UTC
Hi Erdasa,
Greetings from Syncfusion.
We have analysed your requirement. In maps, the markers bind in a data source will have the same style. For rendering markers with different colors/shape, you need to bind multiple data sources similar to the below code snippet. You can bind values to the Fill and Shape properties for changing the color and shape of the marker respectively.
Code snippet -
|
<MapsMarkerSettings>
<MapsMarker Visible='true' DataSource='@markerDataSource' Height="20" Width="20"
AnimationDuration='0' Shape='@Syncfusion.EJ2.Blazor.Maps.MarkerType.Balloon'>
</MapsMarker>
<MapsMarker Visible='true' DataSource='@marker1' Height="20" Width="20" Fill="blue"
AnimationDuration='0' Shape='@Syncfusion.EJ2.Blazor.Maps.MarkerType.Circle'>
</MapsMarker>
<MapsMarker Visible='true' DataSource='@marker2' Height="20" Width="20" Fill="orange"
AnimationDuration='0' Shape='@Syncfusion.EJ2.Blazor.Maps.MarkerType.Circle'>
</MapsMarker>
<MapsMarker Visible='true' DataSource='@marker3' Height="20" Width="20" Fill="pink"
AnimationDuration='0' Shape='@Syncfusion.EJ2.Blazor.Maps.MarkerType.Circle'>
</MapsMarker>
</MapsMarkerSettings>
public List<MapMarkerDataSource> markerDataSource = new List<MapMarkerDataSource> {
new MapMarkerDataSource{ latitude= 37.6276571, longitude= -122.4276688, name= "San Bruno" },
new MapMarkerDataSource{ latitude= 33.5302186, longitude= -117.7418381, name= "Laguna Niguel" },
new MapMarkerDataSource{ latitude= 40.7424509, longitude= -74.0081468, name= "New York" },
};
public List<MapMarker> marker1 = new List<MapMarker> {
new MapMarker { latitude= 50.32087157990324, longitude= 90.015625 }
};
public List<MapMarker> marker2 = new List<MapMarker> {
new MapMarker { latitude= -25.88583769986199, longitude= 134.296875 }
};
public List<MapMarker> marker3 = new List<MapMarker> {
new MapMarker { latitude= 16.97274101999902, longitude= 16.390625 }
}; |
Output Screenshot –
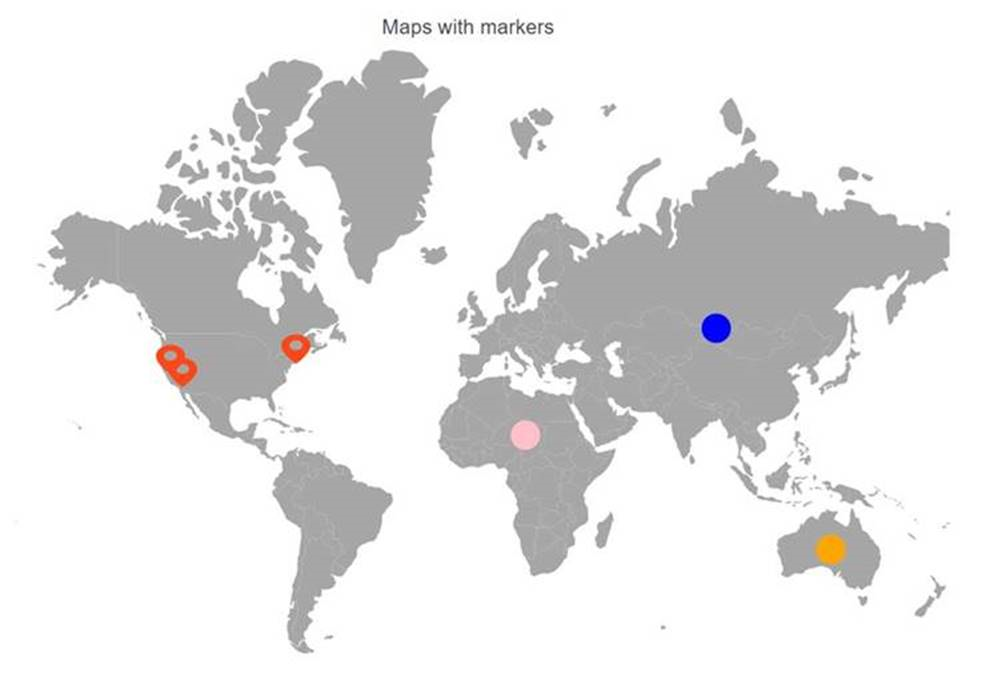
In addition, we have also planned to provide support for customizing the color/shape of each individual marker in the same group by binding values from the data source. You can keep track of the feature from the below feedback. Please cast your vote to make it count. We will prioritize the features of every release based on the demands.
Feedback link: https://www.syncfusion.com/feedback/7644
If you have any more specification or a scenario to be tested, you can add it as a comment in the portal.
Let us know, if you have any concerns.
Thanks,
Baby.
ER
ERDASA
July 24, 2019 03:43 AM UTC
It worked great!
Thanks.
BP
Baby Palanidurai
Syncfusion Team
July 24, 2019 05:24 AM UTC
Hi Erdasa,
Most welcome. Kindly revert us, if you need any further assistance on this. We are always happy in assisting you.
Thanks,
Baby.
Most welcome. Kindly revert us, if you need any further assistance on this. We are always happy in assisting you.
Thanks,
Baby.
BP
Baby Palanidurai
Syncfusion Team
December 18, 2019 12:43 PM UTC
Hi Erdasa,
Thanks for your patience.
We are glad to announce that our Essential Studio Volume 4, 2019 release (v17.4.0.39) is rolled out and is available for download under the following link.
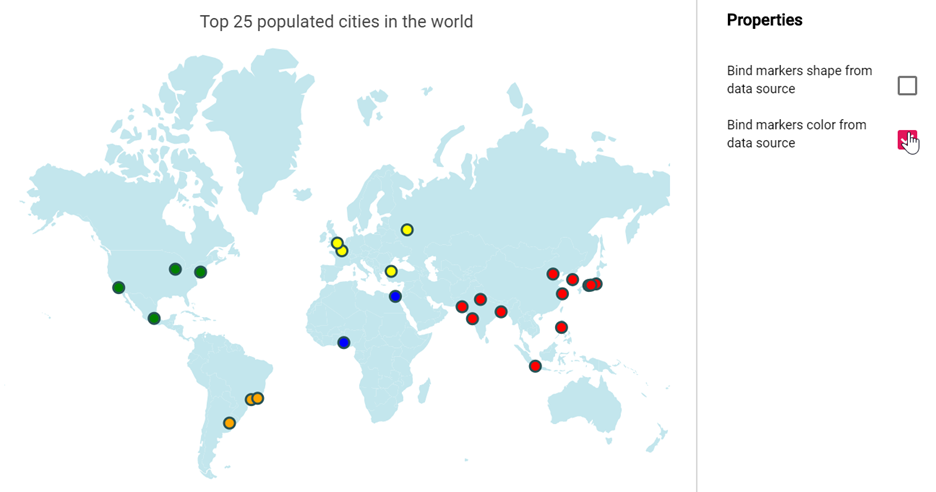
We have included the feature binding color/shape for markers in maps.
The location on the map is marked by different marker shapes using `shapeValuePath` property in `markerSettings`. Based on the field name in the data source bind the value to the `shapeValuePath` property. Also, you can customize the marker shape color by binding the color value field name in the data source to the `colorValuePath` property in `markerSettings`.
Please refer the below code snippet.
|
let map: Maps = new Maps({
layers: [{
shapeData: world_map,
markerSettings: [{
visible: true,
shapeValuePath:'shape',
colorValuePath:'color',
dataSource: [
{ latitude: 49.95121990866204, longitude: 18.468749999999998, name:'Europe', color:'red', shape:'Triangle' },
// Add more
]
}],
}]
}); |
Screenshot:
We thank you for your support and appreciate your patience in waiting for this release. Please get in touch with us if you would require any further assistance.
Regards,
Baby.
SIGN IN To post a reply.
- 4 Replies
- 2 Participants
-
ER ERDASA
- Jul 19, 2019 04:28 PM UTC
- Dec 18, 2019 12:43 PM UTC
