- Home
- Forum
- ASP.NET MVC - EJ 2
- cutomizing tool tip
cutomizing tool tip
I have a multiple series line chart, and I was wondering if there is a way to customize the tooltip so when I hover over a point I can add a comment about the point. Then I will save the comment to my database so next time I look at this graph I can see the comment I left. Wasn't sure if this is possible? Right now my tooltip displays the x and y values for the point I'm hovering over.
Here is my code in the view:
<div>
@Html.EJS().Chart("stdDevAsic").PrimaryXAxis(px => px.Title("Image Number").
ValueType(Syncfusion.EJ2.Charts.ValueType.Category)).Series(series =>
{
for (var i = 0; i < countAsic; i++)
{
series.Type(
Syncfusion.EJ2.Charts.ChartSeriesType.Line
).DataSource(ViewBag.StandardDeviationAsic[i]).Name(ViewBag.AsicNames[i]).XName("ImageNumber").YName("Value").Add();
}
}
).PrimaryYAxis(py => py.Title("Value")).Title("Standard Deviation of Asics").Tooltip(tt => tt.Enable(true)).ZoomSettings(z => z.EnableMouseWheelZooming(true)).Render()
</div>
Thanks.
SIGN IN To post a reply.
2 Replies
KC
Kalaimathi Chellaiah
Syncfusion Team
July 15, 2019 08:28 AM UTC
Hi Team,
We are validating the requested requirement and we will update the status on or before 6:00PM IST (July 15, 2019).
Thanks,
Kalai.
We are validating the requested requirement and we will update the status on or before 6:00PM IST (July 15, 2019).
Thanks,
Kalai.
KC
Kalaimathi Chellaiah
Syncfusion Team
July 15, 2019 01:26 PM UTC
Hi Gideon,
Greetings from Syncfusion.
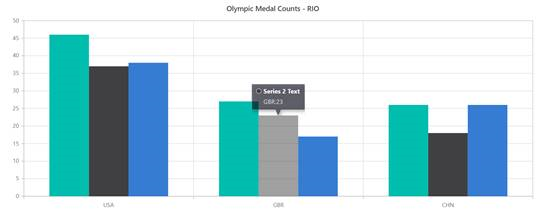
We have analyzed your query. We can achieve your requirement using tooltipRender event. Using this event we can customize the tooltip text and assign it to the args.text. This event fires when hovering over on the chart point. We have prepared a sample based on your requirement. Please find below sample and code snippet,
Code Snippet:
|
var tooltipRender = function (args) {
if (args.series.index == 0) {
args.text = "<b>Series 1 Text</b><br/>" + args.point.x + ':' + args.point.y;
} else if (args.series.index == 1) {
args.text = "<b>Series 2 Text</b><br/>" + args.point.x + ':' + args.point.y;
} else {
args.text = "<b>Series 3 Text</b><br/>" + args.point.x + ':' + args.point.y;
}
} |
Screenshot:
Sample: https://www.syncfusion.com/downloads/support/directtrac/general/ze/tooltiprender-1120788503.zip
Kindly check the above sample and revert us, if you have any queries.
Regards,
Kalai.
SIGN IN To post a reply.
- 2 Replies
- 2 Participants
-
GK Gideon Keys
- Jul 12, 2019 08:07 PM UTC
- Jul 15, 2019 01:26 PM UTC
