- Home
- Forum
- Xamarin.Android
- Line Chart not showing the line!
Line Chart not showing the line!
Hi, I was trying to create a line chart and I couldn't.
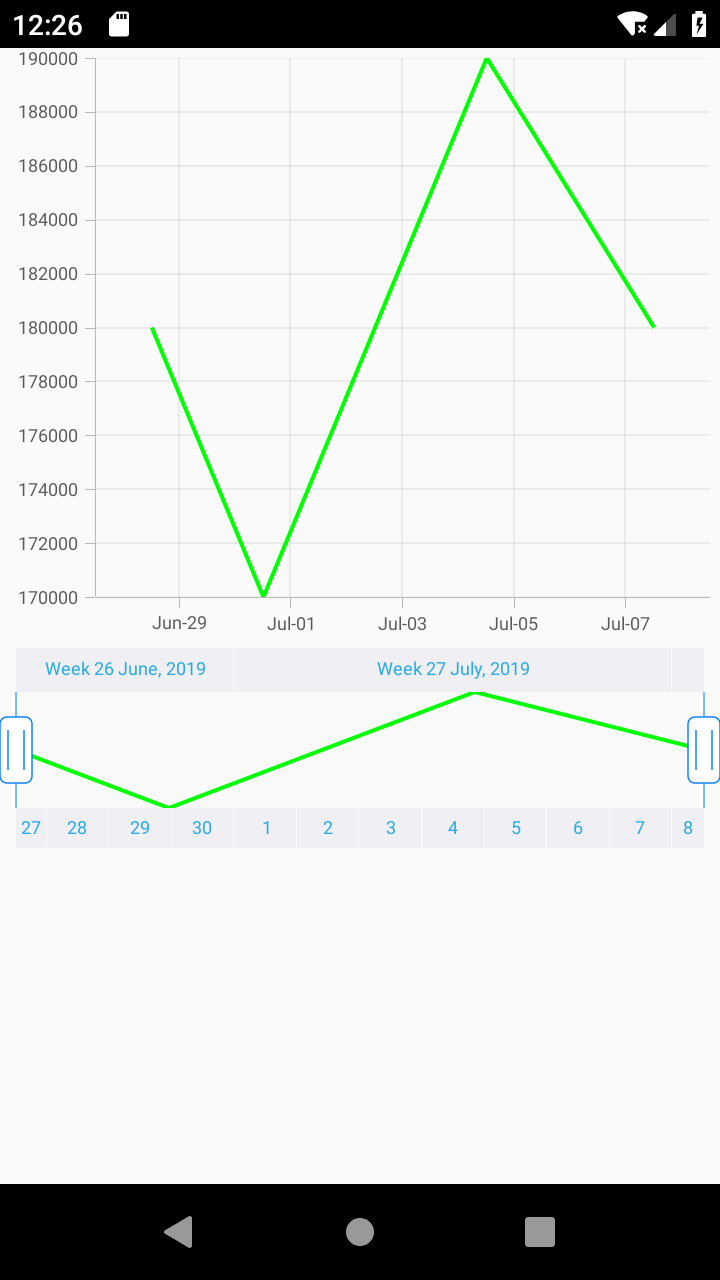
The chart in the SfDateTimeRangeNavigator works fine but the chart itself not showing data, can you tell me what's wrong?
XML Code :
<LinearLayout
android:orientation="vertical"
android:layout_width="match_parent"
android:layout_height="match_parent" >
<Com.Syncfusion.Charts.SfChart
android:layout_width="match_parent"
android:layout_height="300dp"
android:id="@+id/Chart" />
<Com.Syncfusion.Rangenavigator.SfDateTimeRangeNavigator
android:layout_width="match_parent"
android:layout_height="100dp"
android:id="@+id/ChartDateNav" />
</LinearLayout>
C# Code :
SfChart Chart = FindViewById<SfChart>(Resource.Id.Chart);
SfChart NavChart = new SfChart(this);
SfDateTimeRangeNavigator ChartDateNav = FindViewById<SfDateTimeRangeNavigator>(Resource.Id.ChartDateNav);
DateTimeAxis XAxis = new DateTimeAxis();
XAxis.LabelCreated += (sender, e) => {
e.AxisLabel.LabelContent = JDateTime.JDateNTime(DateTime.Parse((string)e.AxisLabel.LabelContent));
};
NumericalAxis YAxis = new NumericalAxis();
ObservableCollection<ChartData> Data = new ObservableCollection<ChartData>() {
new ChartData { Date = DateTime.Now.AddDays(-10), Price = 180000 },
new ChartData { Date = DateTime.Now.AddDays(-8), Price = 170000 },
new ChartData { Date = DateTime.Now.AddDays(-4), Price = 190000 },
new ChartData { Date = DateTime.Now.AddDays(-1), Price = 180000 }
};
LineSeries LSeries = new LineSeries() {
ItemsSource = Data,
XBindingPath = "Date",
YBindingPath = "Price",
Label = "First Product",
TooltipEnabled = true,
Color = Color.Green,
SelectedDataPointColor = Color.DarkGreen
};
ChartTrackballBehavior TrackballBehavior = new ChartTrackballBehavior {
ShowLabel = true,
ShowLine = true
};
Chart.PrimaryAxis = XAxis;
Chart.SecondaryAxis = YAxis;
Chart.Series.Add(LSeries);
Chart.Behaviors.Add(TrackballBehavior);
DateTimeAxis NavXAxis = new DateTimeAxis() {
Visibility = Visibility.Gone,
ShowMajorGridLines = false,
ShowMinorGridLines = false
};
NumericalAxis NavYAxis = new NumericalAxis() {
Visibility = Visibility.Gone,
ShowMajorGridLines = false,
ShowMinorGridLines = false
};
ObservableCollection<ChartData> NavData = new ObservableCollection<ChartData>() {
new ChartData { Date = DateTime.Now.AddDays(-10), Price = 180000 },
new ChartData { Date = DateTime.Now.AddDays(-8), Price = 170000 },
new ChartData { Date = DateTime.Now.AddDays(-4), Price = 190000 },
new ChartData { Date = DateTime.Now.AddDays(-1), Price = 180000 }
};
LineSeries NavLSeries = new LineSeries() {
ItemsSource = NavData,
XBindingPath = "Date",
YBindingPath = "Price",
Color = Color.Green,
};
NavChart.PrimaryAxis = NavXAxis;
NavChart.SecondaryAxis = NavYAxis;
NavChart.Series.Add(NavLSeries);
NavChart.Legend.Visibility = Visibility.Gone;
var Min = DateTime.Now.AddDays(-11);
var Max = DateTime.Now;
ChartDateNav.Minimum = new GregorianCalendar(Min.Year, Min.Month, Min.Day, Min.Hour, Min.Minute, Min.Second).Time;
ChartDateNav.Maximum = new GregorianCalendar(Max.Year, Max.Month, Max.Day, Max.Hour, Max.Minute, Max.Second).Time;
ChartDateNav.RangeChanged += (sender, e) => {
XAxis.Minimum = e.ViewRangeStart;
XAxis.Maximum = e.ViewRangeEnd;
};
ChartDateNav.Content = NavChart;
ChartDateNav.MajorScaleStyle.ShowGridLines = false;
ChartDateNav.MinorScaleStyle.ShowGridLines = false;
SIGN IN To post a reply.
3 Replies
RA
Rachel A
Syncfusion Team
July 8, 2019 07:35 AM UTC
Hi,
Greetings from Syncfusion.
As you are using GregorianCalendar in your code snippet for date calculation, the month value in GregorianCalendar begins at 0. So, the minimum and maximum are wrongly set for the axis and there is no data point lies under the given minimum and maximum value to draw the line chart. To avoid this problem, you can decrease the month by 1 as in the below code snippet. Also, we have prepared a sample based on your code snippet and it can be downloaded from the below link.
[C#]
|
ChartDateNav.Minimum = new GregorianCalendar(Min.Year, Min.Month - 1, Min.Day, Min.Hour, Min.Minute, Min.Second).Time;
ChartDateNav.Maximum = new GregorianCalendar(Max.Year, Max.Month - 1, Max.Day, Max.Hour, Max.Minute, Max.Second).Time; |
You can check the below links for reference.
Output:
Regards,
Rachel.
XA
Xamarin
July 8, 2019 08:43 AM UTC
Wow, Thank you soooo much, It totally worked out.
Really didn't see that coming as the answer!
RA
Rachel A
Syncfusion Team
July 8, 2019 08:52 AM UTC
Hi,
We are glad that the reported problem resolved at your end. Please let us know, if you have any other queries.
Thanks,
Rachel.
SIGN IN To post a reply.
- 3 Replies
- 2 Participants
-
XA Xamarin
- Jul 7, 2019 04:23 AM UTC
- Jul 8, 2019 08:52 AM UTC
