- Home
- Forum
- React - EJ 2
- Does the stock component have the option to turn on and off extended trading hours?
Does the stock component have the option to turn on and off extended trading hours?
Does the stock component have the option to turn on and off extended trading hours?
I applied my trading history data and there are large gaps in the chart where there is 0 data during extended hours but I do not see an option to hide extended hours.
Extended hours are also called pre-market or after hours this includes weekends and market closed days.
SIGN IN To post a reply.
9 Replies
BP
Baby Palanidurai
Syncfusion Team
June 20, 2019 06:31 AM UTC
Hi z,
Greetings from Syncfusion.
We have analyzed your query. We are not clear about your exact problem. We have prepared a sample with 0 data values. Please find below-attached screenshot and sample. If you mean this is the problem are you facing, then revert us with following the information which will be more helpful for further analysis and provide you the solution sooner.
Screenshot:
· Please share your sample (or) code snippet.
· Try to replicate the reported scenario in the above sample.
· Share more information about your exact problem.
· Share your data source file
Regards,
Baby.
ZQ
z q
June 20, 2019 05:58 PM UTC
The problem is that in the US stock markets, the market is ONLY open from 9:30 am - 4pm with extended hours from 7 am - 9: 30am and 4 pm - 8pm. From 8pm - 7am the next day there is usually 0 trading data available since the market it closed. the result is charts that look like below. As you can see there is a big gap between 16:00 and 9:30 since the market is closed.


Other charting software acknowledges this fact and compresses the chart so that there is 0 gap. eg
How does syncfusion deal with 0 trading data between extended hours? This is a 1 min chart over 2 days, imagine a 1 minute chart over a week, there will be 4 gaps in the chart where 0 trading history exists.
BP
Baby Palanidurai
Syncfusion Team
June 21, 2019 11:43 AM UTC
Hi z,
Thanks for the update.
We are analyzing the possibilities of your requested requirement and we will update the status within three business days(June 26, 2019). We appreciate your patience until then.
Regards,
Baby.
KC
Kalaimathi Chellaiah
Syncfusion Team
June 26, 2019 01:26 PM UTC
Hi z,
Thanks for being patience.
As of now, we have a stock chart support only for linear interval axis. In your scenario, it depends on the non-linear interval axis. Currently, the chart only has a non-linear interval axis support when we use dateTimeCategory Axis. So we are analyzing the possibilities to implement non-linear interval axis for a stock chart and we will update the status if this is possible or not within three days. We appreciate your patience until then.
Regards,
Kalai.
ZQ
z q
June 26, 2019 02:00 PM UTC
Thanks no problem
KC
Kalaimathi Chellaiah
Syncfusion Team
June 27, 2019 01:30 PM UTC
Hi z,
Most welcome. As stated earlier we will update the status within three business days. We appreciate your patience until then.
Regards,
Kalai.
KC
Kalaimathi Chellaiah
Syncfusion Team
July 1, 2019 12:01 PM UTC
Hi z,
Thanks for being patience.
We have analyzed your query. As of now, we are having only linear axis support for stock chart. Also currently there is no possible to achieve your requirement.
Kindly revert us, if you need further assistance. We are always happy in assisting you.
Regards,
Kalai.
JP
John Phillips
September 29, 2022 12:38 AM UTC
This is an important feature that I hope Syncfusion takes seriously and implements. Rendering intraday stock charts makes no sense when there is always a massive gap between one day's market close and the next day's market open.
DG
Durga Gopalakrishnan
Syncfusion Team
September 29, 2022 02:04 PM UTC
Hi John,
We suggest you to render stock chart with datetime axis type itself. Since, datetime value type displays date time values in linear interval, when providing the empty data for few points in chart series datasource, then date labels will be displayed in linear order.
Please check with the below online demo link.
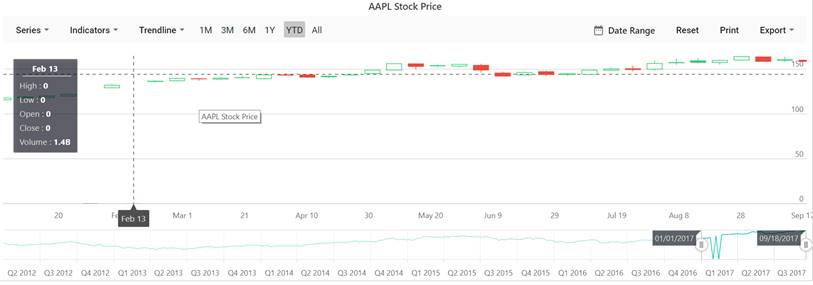
Online Demo : https://ej2.syncfusion.com/react/demos/#/material/stock-chart/default
Kindly revert us if you have any concerns.
Regards,
Durga Gopalakrishnan.
SIGN IN To post a reply.
- 9 Replies
- 5 Participants
-
ZQ z q
- Jun 20, 2019 02:09 AM UTC
- Sep 29, 2022 02:04 PM UTC
