- Home
- Forum
- JavaScript - EJ 2
- Combo charts
Combo charts
Hello,
Is it possible to have combo charts? E.g. a chart with both a column and line chart?
regards
Raghav
SIGN IN To post a reply.
4 Replies
DB
Dinesh Babu Yadav
Syncfusion Team
June 19, 2019 06:53 AM UTC
Hi Raghav,
Thank you for contacting Syncfusion support.
You can change the chart type for each series in chartSeriesCreated event. Please refer the following code snippet to achieve the reported requirement.
Code Snippet:
|
var pivotGridObj = new ej.pivotview.PivotView({
displayOption: { view: "Chart" },
chartSeriesCreated: (args) => {
for (var pos = 0; pos < args.series.length; pos++) {
if (pos % 2 == 0) {
args.series[pos].type = 'Line';
}
}
},
chartSettings: {
title: "Sales Analysis",
chartSeries: { type: "Column" },
}
});
pivotGridObj.appendTo("#PivotView");
|
Please let us know if you need further assistance on this.
Regards,
Dinesh Babu Yadav
RA
Raghav
June 21, 2019 12:07 PM UTC
Hello Dinesh,
Attachment: Desktop_832f8ed2.rar
First of all Thanks for the help. Dinesh, The code you shared with its not working. I am using toolbar in syncfusion. When ever I changed the chart type dropdown it show online chart type of line.I am sharing the two screenshot with you. Please look into this.
Regards
Raghav
Attachment: Desktop_832f8ed2.rar
RA
Raghav
June 21, 2019 01:22 PM UTC
Hello Dinesh,
I have one query. When I set one chart type is "Line" and another is "Bar" then in pivotchart two chart of line type is visible. Can you please tell me its a bug or default behavior of plugin. I have attached the screenshot. Please look into this and help me on my query.
Regards
Raghav
Attachment: code_example_f82e821e.rar
JP
Jagadeesan Pichaimuthu
Syncfusion Team
June 24, 2019 09:05 AM UTC
Hi Raghav,
Please find the response below.
|
|
Query |
Comments |
|
1. |
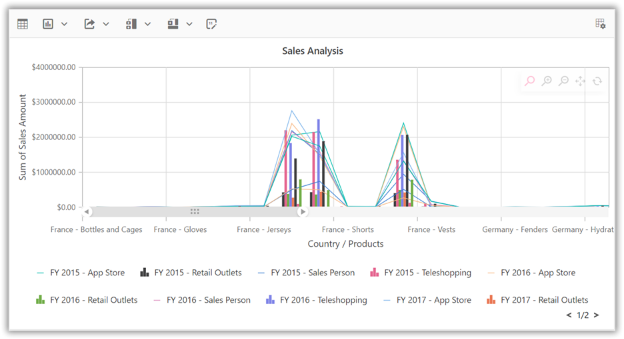
First of all, Thanks for the help. Dinesh, the code you shared with its not working. I am using toolbar in syncfusion. Whenever I changed the chart type dropdown it shows online chart type of line. I am sharing the two screenshots with you. Please look into this. |
In the sample, we have applied ‘Line’ chart type for two series. And, we suspect that, Column series are hidden due to large data. You can check this problem with using scroll/ zoom options in pivot chart. Please refer the following screenshot.
 |
|
2. |
I have one query. When I set one chart type is "Line" and another is "Bar" then in pivotchart two chart of line type is visible. Can you please tell me it’s a bug or default behavior of plugin? I have attached the screenshot. Please look into this and help me on my query. |
You cannot combine Bar/Polar chart to other chart types. It’ is the default behavior of the chart. |
Please let us know if any concerns.
Regards,
Jagadeesan
SIGN IN To post a reply.
- 4 Replies
- 3 Participants
-
RA Raghav
- Jun 18, 2019 11:23 AM UTC
- Jun 24, 2019 09:05 AM UTC
