Set InteractiveCursor to mouse position
I want to click on the graph and set a vertical cursor to the position on the graph where I clicked with the mouse.
The X-Axis on my graph is time. I also need the time to be able to look up values for all series on the graph at this time.
I can't figure out how to do this in WinForms. I'm using s line graph with several series.
Thanks!
SIGN IN To post a reply.
5 Replies
BP
Baby Palanidurai
Syncfusion Team
June 13, 2019 12:16 PM UTC
Hi Ola,
Greetings from Syncfusion. We have analyzed your query. As of now, we are having interactive cursor only. In that we couldn’t customize to provide some details about the information when on click. Please find the below documentation link for interactive cursor,
We can show the information on mouse move using trackball features. Please find the below documentation link for track ball,
Code snippet:
|
this.chartControl1.PrimaryXAxis.ValueType = ChartValueType.DateTime;
this.chartControl1.Trackball.DisplayMode = TrackballTooltipDisplayMode.Float;
this.chartControl1.Trackball.Visible = true; |
Screenshot:

If this is doesn’t meet your requirement, kindly revert us.
Regards,
Baby.
OM
Ola Mallaug
June 19, 2019 01:11 PM UTC
The trackball feature is a nice feature, but I'm really interested in the data from the graph when clicking on the graph. What you are saying is that there is no way to get the location or any data about where the user clicked on the graph?
BP
Baby Palanidurai
Syncfusion Team
June 20, 2019 10:05 AM UTC
Hi Ola,
Thanks for your update.
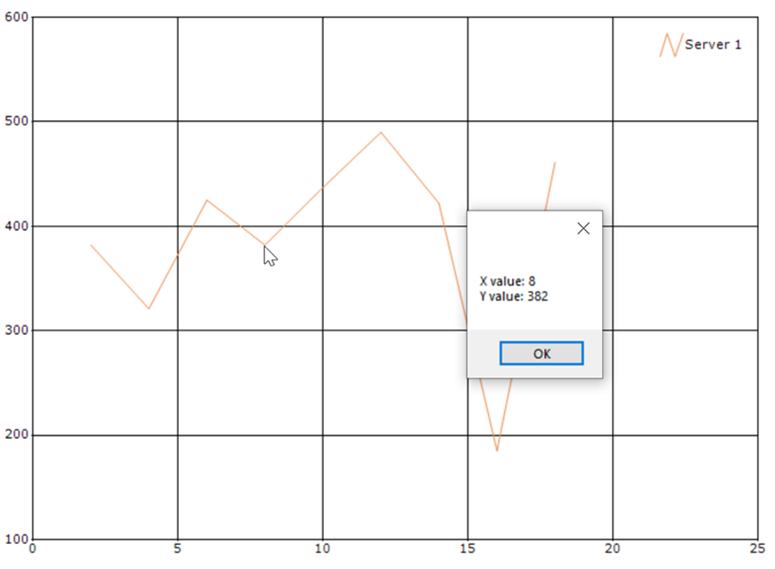
We have analyzed your query. We are having chartRegionClick event. In this event will return the point and series index as arguments. When we click apart from series points region, it will return point and series index as -1. So based on this, you can find the series and point index and the point values from this. If you want to show tooltip for these values in a click event, you need to draw the tooltip in own.
We have prepared a sample with chartRegionClick event. In that event, we have shown the point x and y values in message box.
Code snippet:
|
this.chartControl1.ChartRegionClick += ChartControl1_ChartRegionClick;
private void ChartControl1_ChartRegionClick(object sender, ChartRegionMouseEventArgs e)
{
int pointIndex = e.Region.PointIndex;
int seriesIndex = e.Region.SeriesIndex;
if (pointIndex != -1)
{
MessageBox.Show("X value: " + this.chartControl1.Series[seriesIndex].Points[pointIndex].X +"\nY value: " + this.chartControl1.Series[seriesIndex].Points[pointIndex].YValues[0]);
}
} |
Screenshot:
Sample link: https://www.syncfusion.com/downloads/support/directtrac/general/ze/chartClick1018127429
For more information above chart events, kindly find the below documentation link,
Kindly revert us, if you have any concerns.
Regards,
Baby.
OM
Ola Mallaug
July 12, 2019 01:35 AM UTC
Thank you for your help.
The demo works, I wish I didn't have to click on the graph trace itself, just on the graph and get the X position.
I tried to use this in my application and I get 'e.Region.PointIndex 'e.Region.PointIndex' threw an exception of type 'System.NullReferenceException'
My function and event are the same as the sample. I'm using the same version of Syncfusion as the sample as well. Any suggestion?
BP
Baby Palanidurai
Syncfusion Team
July 12, 2019 08:36 AM UTC
Hi Ola,
Thanks for your update.
We have checked your query and event is working at our end. Still we are not aware which is replicate the issue, so we couldn’t predict the issue at our end. Kindly provide your sample with replication steps which will be helpful in furthermore analysis and provide you the solution sooner.
Regards,
Baby.
SIGN IN To post a reply.
- 5 Replies
- 2 Participants
-
OM Ola Mallaug
- Jun 13, 2019 03:06 AM UTC
- Jul 12, 2019 08:36 AM UTC
