- Home
- Forum
- ASP.NET Core - EJ 2
- Alignment of the axis
Alignment of the axis
I have a question:

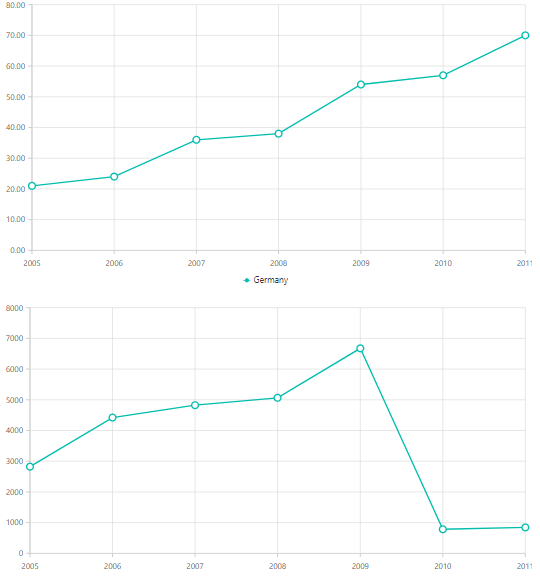
How can I align the position of the Y axis when there are multiple charts on a page? As shown in the screenshot below
Thanks
SIGN IN To post a reply.
5 Replies
DD
Dharanidharan Dharmasivam
Syncfusion Team
September 12, 2018 12:44 PM UTC
Hi Bright,
Thanks for using Syncfusion products.
We have analyzed your query and your requirement can be achieved by the following methods.
Method 1: Using Ranges
You can specify the same range (minimum, maximum and interval) for both charts, so that axis will not be misaligned.
Please find the below code snippet to achieve this requirement,
|
<ejs-chart>
<e-chart-primaryyaxis
minimum=0
maximum=3500
interval=500>
</e-chart-primaryyaxis>
<ejs-chart> |
Here we have specified the range and you can change this with respect to your requirement.
Method 2: Using Label Format
Set the labelFormat of the axis as n2 for the chart whose y axis numeric label length is less than the other one. For more information on label formats, kindly find the below help documentation link,
Please find the below code snippet to achieve this requirement,
|
<ejs-chart>
<e-chart-primaryyaxis labelFormat="n2">
</e-chart-primaryyaxis>
<ejs-chart> |
Here we have specified the labelFormat as n2, this can be changed with respect to your scenario.
Screenshot:
Sample for your reference can be find from below link,
Thanks,
Dharani.
BR
bright
September 13, 2018 02:26 AM UTC
Thank you very much for your reply, but this does not solve my problem, because the range of each chart is dynamically changed. If changing the labelFormat will affect the display effect, what I need is to use the range data of the Y axis in the screenshot to make the Y axis Align in the vertical direction
DD
Dharanidharan Dharmasivam
Syncfusion Team
September 13, 2018 11:57 AM UTC
Hi Bright,
We have analyzed your query and your requirement can be achieved using axisRangeCalculated event. We have created a sample in which we have triggered this event for both the charts. We have stored the ranges of first chart globally and in the second chart’s axisRangeCalculated, we have checked the range of both charts and assigned to a chart whose range is lower than another chart.. Find the code snippet below to achieve this requirement.
|
<ejs-chart id="container1" axisRangeCalculated="rangeChart1" >
</ejs-chart>
<ejs-chart id="container2" axisRangeCalculated="rangeChart2" >
</ejs-chart>
var chart1Min, chart1Max, chart1Interval;
//Event for 1st chart
function rangeChart1(args) {
if (args.axis.orientation === 'Vertical') {
//Stored the ranges globally
chart1Min = args.minimum;
chart1Max = args.maximum;
chart1Interval = args.interval;
}
}
//Event for 2nd chart
function rangeChart2(args) {
if (args.axis.orientation === 'Vertical') {
//Assigned the ranges
if (args.maximum >= chart1Max) {
var chart1Obj = document.getElementById('container1').ej2_instances[0];
chart1Obj.primaryYAxis.maximum = args.maximum;
chart1Obj.primaryYAxis.minimum = args.minimum;
chart1Obj.primaryYAxis.interval = args.interval;
chart1Obj.refresh();
} else {
args.maximum = chart1Max;
args.minimum = chart1Min;
args.interval = chart1Interval;
}
}
}
|
Sample for reference can be find here.
Thanks,
Dharani.
BR
bright
July 23, 2019 02:46 AM UTC
Hi Dharani,
Thanks,
Bright.
KC
Kalaimathi Chellaiah
Syncfusion Team
July 24, 2019 06:01 PM UTC
Hi bright,
Thanks for your update.
We have analyzed your query. From that we are not clear about your exact query. We suspect you want customize y axis label using digits or any other formats. So we suggest to use axisLabelRender event to customize axis text based on axis orientation. We have modified previous update sample. In that, we have added zero in front of each y axis label text. Please check the below code snippet and screenshot,
Code Snippet:
|
@using Syncfusion.EJ2;
<div>
<div class="container1" style="width:800px">
<ejs-chart id="container1" height="350px" axisLabelRender="labelRender" >
<e-chart-tooltipsettings enable="true">
</e-chart-tooltipsettings>
<e-chart-primaryxaxis valueType="DateTime"
labelFormat="y">
</e-chart-primaryxaxis>
<e-chart-chartarea>
<e-chartarea-border width="0"></e-chartarea-border>
</e-chart-chartarea>
<e-series-collection>
<e-series dataSource="ViewBag.dataSource" name="Germany" xName="xValue" width="2" opacity="1" yName="yValue" type="@Syncfusion.EJ2.Charts.ChartSeriesType.Line">
<e-series-marker visible="true" height="10" width="10"></e-series-marker>
</e-series>
</e-series-collection>
</ejs-chart>
</div>
<div class="container2" style="width:800px">
<ejs-chart id="container2" height="350px" >
<e-chart-tooltipsettings enable="true">
</e-chart-tooltipsettings>
<e-chart-primaryxaxis valueType="DateTime"
labelFormat="y">
</e-chart-primaryxaxis>
<e-chart-primaryyaxis>
</e-chart-primaryyaxis>
<e-chart-chartarea>
<e-chartarea-border width="0"></e-chartarea-border>
</e-chart-chartarea>
<e-series-collection>
<e-series dataSource="ViewBag.dataSource" name="Germany" xName="xValue" width="2" opacity="1" yName="yValue1" type="@Syncfusion.EJ2.Charts.ChartSeriesType.Line">
<e-series-marker visible="true" height="10" width="10"></e-series-marker>
</e-series>
</e-series-collection>
</ejs-chart>
</div>
</div>
<script>
var labelRender = function (args) {
if (args.axis.orientation === 'Vertical') {
args.text = "0" + args.text;
}
}
</script> |
Screenshot:

Also here we have attached UG link for more information about numeric axis,
Chart: https://ej2.syncfusion.com/aspnetcore/documentation/chart/numeric-axis/?no-cache=1#label-format
Kindly check the above sample and UG link and revert us with more information if this is not your exact requirement.
Regards,
Kalai.
SIGN IN To post a reply.
- 5 Replies
- 3 Participants
-
BR bright
- Sep 12, 2018 10:45 AM UTC
- Jul 24, 2019 06:01 PM UTC
