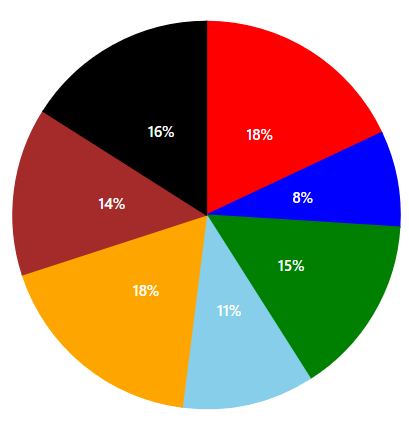
|
series: [
{
dataSource: [
{ x: 'Labour', y: 18, text: '18%' , color: 'red'},
{ x: 'Legal', y: 8, text: '8%' , color: 'blue'},
{ x: 'Production', y: 15, text: '15%' , color: 'green'},
{ x: 'License', y: 11, text: '11%' , color: 'skyblue'},
{ x: 'Facilities', y: 18, text: '18%' , color: 'orange'},
{ x: 'Taxes', y: 14, text: '14%' , color: 'brown'},
{ x: 'Insurance', y: 16, text: '16%' , color: 'black'}
],
pointColorMapping: 'color',
}
], |