- Home
- Forum
- ASP.NET MVC
- Bubble chart Excel export: Data gets scrumbled while exporting data to Excel
Bubble chart Excel export: Data gets scrumbled while exporting data to Excel
Hi,
When I try to export a bubble chart data to an Excel spreadsheet, there are several errors:
1. The data series for X and Y axis and the bubble size data seems to be shifted when data is exported to Excel. As a result, Axis X is shfted to Axis Y, Data in Axis Y is shifted to the bubble data,and so on.
2. The colors of the bubbles in Excel are all the same and different than the ones on the chart objects.
How can we fix theses problems?
Thanks in advance.
Ayben.
SIGN IN To post a reply.
5 Replies
SK
Saravana Kumar Kanagavel
Syncfusion Team
September 20, 2017 05:03 PM UTC
Hi Ayben,
Thanks for contacting Syncfusion Support.
We have analyzed your queries and please find the response below for your queries.
Query 1: The data series for X and Y axis and the bubble size data seems to be shifted when data is exported to Excel. As a result, Axis X is shfted to Axis Y, Data in Axis Y is shifted to the bubble data,and so on.
We have tried to reproduce the reported issue but unfortunately not able to reproduce the reported issue at out end.
So we have prepared the sample for your reference and attached in the below location.
Query 2 : The colors of the bubbles in Excel are all the same and different than the ones on the chart objects.
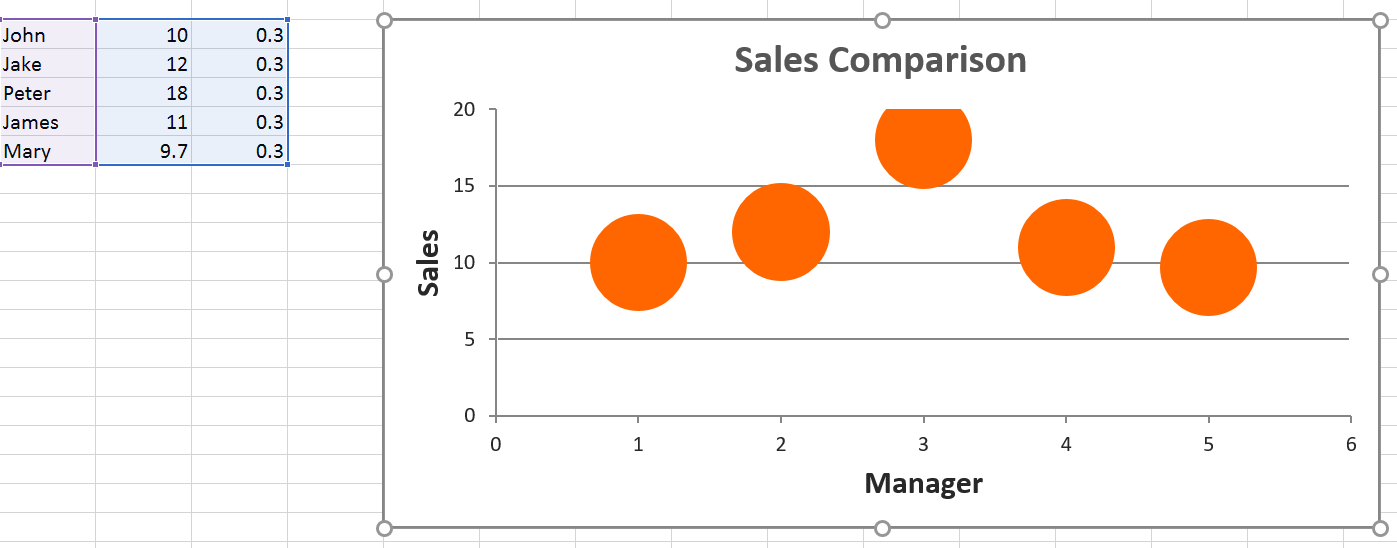
If you wish to change the color for the series , then please refer the code example below
| [C#] ChartProperties obj = ConvertChartObject(ChartModel); obj.Series[0].Fill = "#4286F4"; |
In the above code, we are changing the series color by using “Fill” property in chart.
Please find screenshot of excel export from the below
If you still face any concern , kindly revert us with issue reproducing sample or modified the attached sample to provide the exact solution sooner.
Please let us know if you have any concern on this.
Regards,
Saravana Kumar K
AY
ayben
September 22, 2017 02:04 PM UTC

 Hi,
Hi,
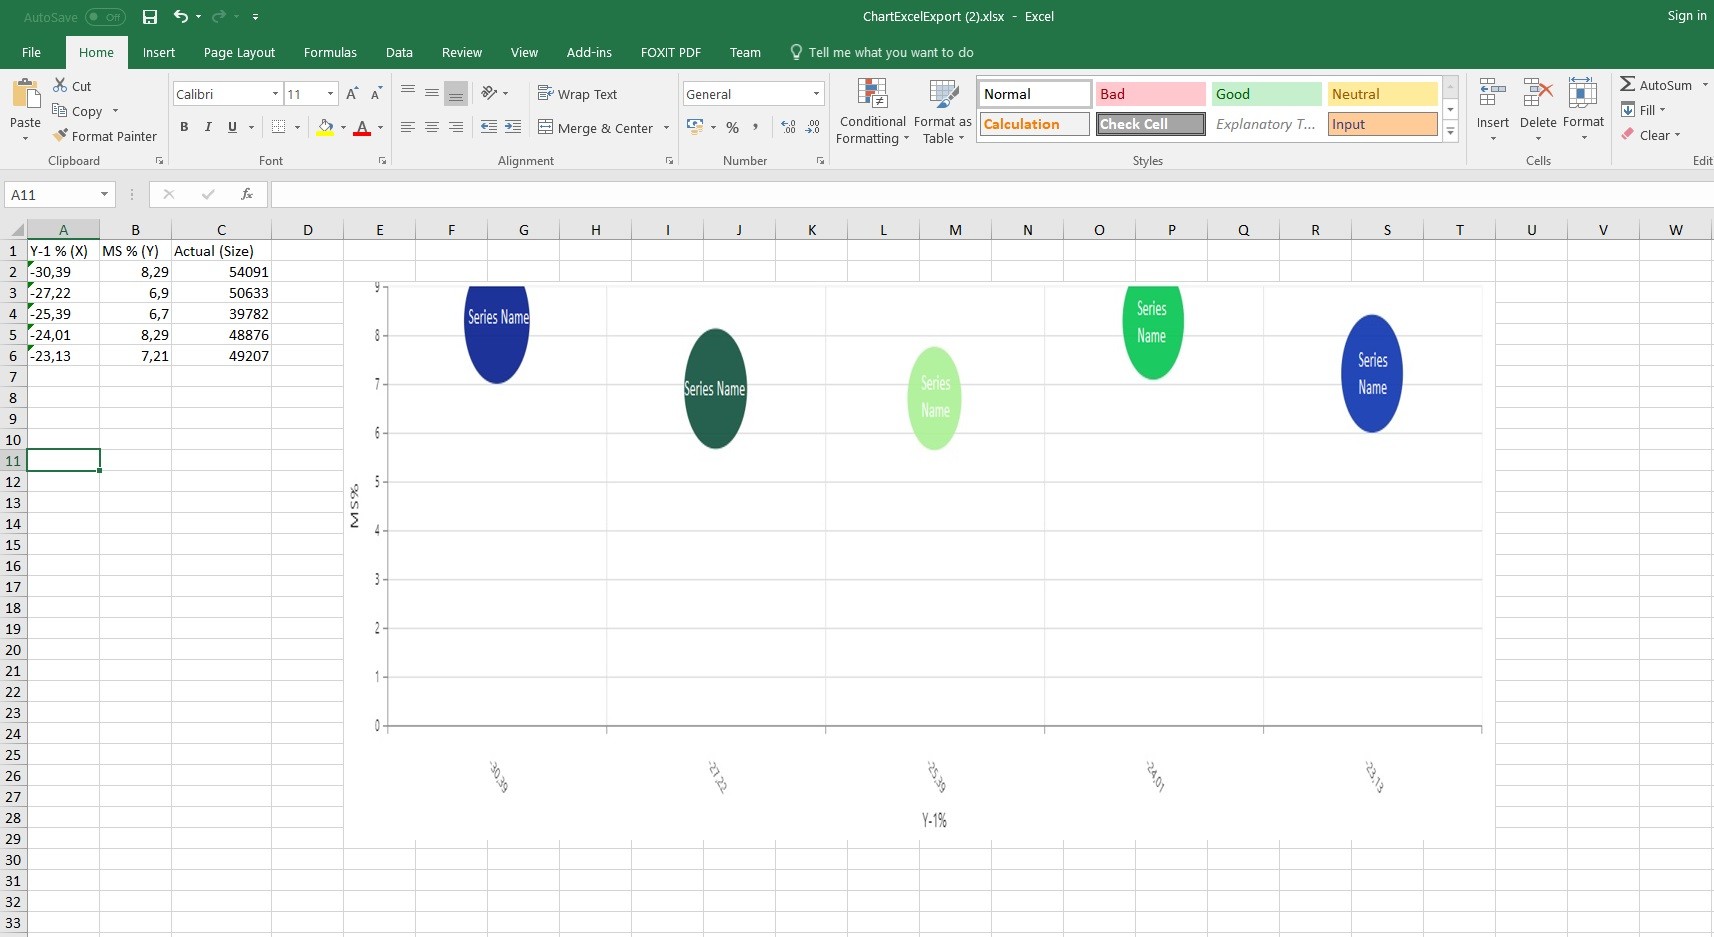
Thanks for your answer. May I ask you a few questions? I send my excel output picture to you. picture link("https://i.hizliresim.com/7yoAoP.jpg")
1. How can I occur this buble chart data an Excel?
2. How can I transfer to excel in this graphic as picture?
3. How can I occur this buble chart for use XlslO library?
Thanks in advance
Ayben
SS
Sridhar Sukumar
Syncfusion Team
September 25, 2017 12:41 PM UTC
Hi Ayben,
Thank you updating us.
Your requirement cannot be achieved by creating bubble chart in Excel. As per MS Excel behavior, the bubble chart categories axis should be numeric axis. But in the shared picture, the bubble chart category axis is text axis.
However, we have prepared a workaround sample by creating Line with Marker chart to achieve your requirement. The sample can be downloaded from the following link.
Sample link:
Please let us know if you have any concern.
Regards,
Sridhar.
AY
ayben
October 2, 2017 09:22 AM UTC
Hi,
Thanks for your answer. I want to import the graphic as an image in Excel. How can I do that ?
Thanks in advance.
Ayben.
SS
Sridhar Sukumar
Syncfusion Team
October 3, 2017 01:59 PM UTC
Hi Ayben,
Thank you for updating us.
The images can be inserted into worksheet using Pictures.AddPicture() method. Please refer the following UG documentation link to achieve your requirement.
UG Documentation: https://help.syncfusion.com/file-formats/xlsio/working-with-pictures
Please let us know if you have any concern.
Regards,
Sridhar.
SIGN IN To post a reply.
- 5 Replies
- 3 Participants
-
AY ayben
- Sep 18, 2017 02:07 PM UTC
- Oct 3, 2017 01:59 PM UTC
