Chart Column Different Color

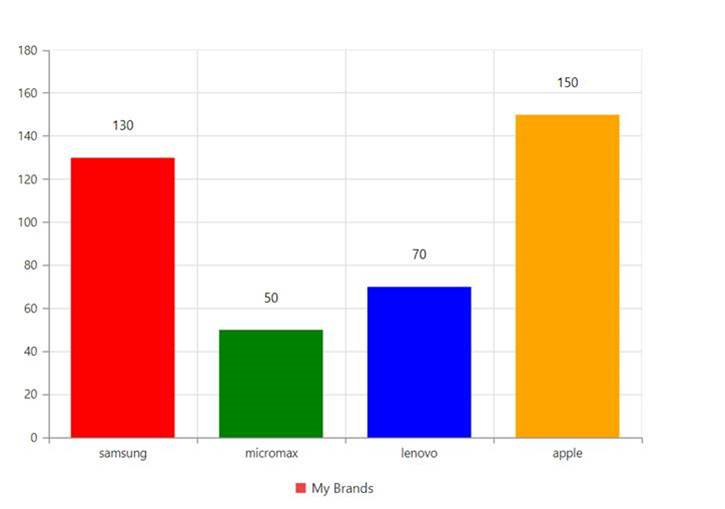
Hi i would like to know if its possible to put different color on each Column series that its generated by data source??

.Series(ser =>

       {

           ser.Name("My Brands");

           ser.DataSource((IEnumerable<object>)ViewBag.brand);

           ser.LabelPosition(ChartLabelPosition.Outside);

           ser.Marker(mr => mr

                     .DataLabel(label => label

                         .Visible(true)

                         .Offset(15)

                         .Font(font => font.Color("black").Size("12px"))

                         )

                 );

           ser.Explode(true);

           ser.XName("Brand");

           ser.YName("Total");

           ser.Font(f =>

           {

               f.Size("px");

               f.Color("#8CC640");

           });

           ser.Add();


       })


3 Replies

SK Saravana Kumar Kanagavel Syncfusion Team September 4, 2017 04:52 AM UTC

Hi Gian, 
 
Thanks for contacting Syncfusion Support. 
We have analyzed your query and achieved your requirement by using “pointColorMapppingName” property in the series . “pointColorMapppingName” property is used to get the fill color of each points from the data source. 
 
Please refer the code example below 
 
[CSHTML] 
@(Html.EJ().Chart("container") 
         .Series(ser => 
         {  
            ser.PointColorMappingName("Color"); 
         }) 
)    
 
Here ‘color’ is the name of the field, which holds the color values in the data source. We have prepared a sample for your reference and attached in the below location. 
 
  
Please find the output of the sample below 
 
 
Please let us know if you have any concern.

Regards,
Saravana Kumar K 


GC Gian Carlo September 11, 2017 04:48 PM UTC

Thx a lot for the reply,


SK Saravana Kumar Kanagavel Syncfusion Team September 12, 2017 09:53 AM UTC

Hi Gian, 

Thanks for the update. 

Please let us know if you need any further assistance on this. 

Regards, 
Saravana Kumar K. 


Loader.
Up arrow icon