- Home
- Forum
- ASP.NET Core
- Pie Chart Marker with Currency dan Percentage
Pie Chart Marker with Currency dan Percentage
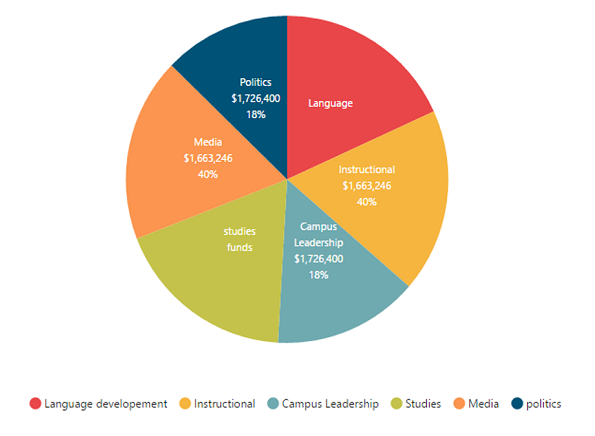
How to create Pie Chart provided in help content which shows Legend, Currency and Percentage at the same time inside the Pie Chart?
SIGN IN To post a reply.
5 Replies
DD
Dharanidharan Dharmasivam
Syncfusion Team
July 31, 2017 12:02 PM UTC
Hi Rix,
Thanks for contacting Syncfusion support.
We have analyzed your query. The legend can be made visible by specifying true to visible property of legend and the labels can be made visible by specifying true to visible property of dataLabel in marker. When the data label is enabled, by default y values will be displayed as data label and the labels will be visible inside the pie chart. If you need to display the particular text in the pie chart, then by using text property of points and the position of labels can be controlled by labelPosition of series property. For more information on data labes, find the help document and for more information on legend, find the document. You can change this with respect to your requirement. Find the code snippet below to achieve this requirement.
|
ASP.NET Core:
<ej-chart>
//Made legend visible
<e-legend visible="true"></e-legend>
<e-chart-series>
//Data label position
<e-series label-position="Inside" >
<e-points>
//Text to be displayed in pie series
<e-point x="Other Personal" y="30" text="Other Personal, 88.47%"></e-point>
<e-point x="Medical care" y="34" text="Medical care, 8.49%"></e-point>
//...
</e-points>
<e-marker>
//Data label visibility
<e-data-label visible="true">
</e-data-label>
</e-marker>
</e-series>
</e-chart-series>
|
Screenshot:
If you need to format the labels to percentage/currency, then using displayTextRendering event, the labels can be formatted. In this event you can use ej.format method to format the labels. Here you need to pass the value with the required format as depicted below.
|
<ej-chart display-text-rendering="labelsRender">
</ej-chart>
function labelsRender(sender) {
sender.data.text = ej.format(sender.data.text, "p1");
} |
Screenshot:
Sample for reference can be find from below link.
Thanks,
Dharani.
RI
Rix
August 1, 2017 02:19 PM UTC
thank you for the answer.
is it possible to do iteration inside <e-point>? it gave error about tag helper.
DD
Dharanidharan Dharmasivam
Syncfusion Team
August 2, 2017 06:33 PM UTC
Hi Rix,
Thanks for your revert.
We have analyzed your query. As of now if you need to iterate the points, then you can achieve this in load event of chart. You can change this with respect to your requirement. Find the code snippet below to achieve this requirement.
|
<ej-chart id="container" can-resize="true" load="chartLoad">
</ej-chart>
var x = [1, 2, 3, 4, 5, 6, 7, 8];
var y = [12, 23, 31, 29, 34, 21, 26, 31, 42];
function chartLoad(sender) {
sender.model.series[0].points = [];
for (var i = 0; i < 8; i++)
sender.model.series[0].points.push({ x: x[i], y: y[i] });
} |
Screenshot:
Sample for reference can be find from below link.
Dharani.
RI
Rix
August 9, 2017 03:19 AM UTC
hi Dharanidharan,
thank you for you answer. what i meant was, how can i do iteration inside
<e-series label-position="Inside" >
                         <e-points>
                            @{ foreach( var item in Model)
                                {
                                    <e-point x="@Model.XData" y="@Model.YData" text="@Model.Text">e-point>
                                }
                        e-points>
it gives error "The parent
this is what i'm trying to achieve

please assist me on this. thank you.
DD
Dharanidharan Dharmasivam
Syncfusion Team
August 9, 2017 02:29 PM UTC
Hi Rix,
Thanks for your update.
As of now you can’t able to do iteration inside the points tag. And we suspect that your requirement is to add data label to individual points from the data source. If so, we have already provided a property textMappingName in series.marker.dataLabel for mapping labels from the data source. Find the code snippet below to achieve this requirement.
|
ASP.NET core:
<ej-chart >
<e-chart-series>
<e-series x-name ="Xvalue" y-name="YValue1" datasource="ViewBag.chartData">
<e-marker>
<e-data-label visible="true" text-mapping-name="Text">
</e-data-label>
</e-marker>
</e-series>
</e-chart-series>
</ej-chart>
|
Screenshot:
Sample for reference can be find from below link.
Else as stated in our previous update, you can iterate the points in the load event of chart. Kindly revert us, if you have any concern.
Thanks,
Dharani.
SIGN IN To post a reply.
- 5 Replies
- 2 Participants
-
RI Rix
- Jul 28, 2017 08:17 AM UTC
- Aug 9, 2017 02:29 PM UTC
