DrillDown Chart is not working for more than 100 record
container.ejChart(
{
//Initializing Common Properties for all the series
commonSeriesOptions:
{
type: type,
enableAnimation: true,
tooltip: { visible: true, format: "#series.name# <br/> #point.x# : #point.y#" },
marker:
{
dataLabel:
{
font: { size: '13px', fontFamily: 'Segoe UI', fontStyle: 'Normal', fontWeight: 'regular' },
textPosition: 'top',
horizontalTextAlignment: "near",
visible: true
},
}
},
//Initializing Series
series:
[
{
points: seriesData.points,
name: seriesData.name,
//explode: true,
//enableAnimation: true,
//marker:
//{
// dataLabel:
// {
// visible: true,
// //font: { size: '24px', color: "#FFFFFF" }
// }
//}
}
],
load: "loadTheme",
isResponsive: true,
pointRegionClick: function (sender) {
var pointIndex = sender.data.region.Region.PointIndex;
TextID.innerHTML = sender.model._visibleSeries[0]._visiblePoints[pointIndex].x;
var ID = sender.model._visibleSeries[0]._visiblePoints[pointIndex].ID;
if (sender.model.series[0].name == seriesData.name) {
if (itemCatID != null)
pieSeriesfunction(container, pieSeriesTitle, null, null, ID, null, null);
else if (costCodeID != null)
pieSeriesfunction(container, pieSeriesTitle, null, null, null, ID, null);
else if (costType != null) {
var text = sender.model._visibleSeries[0]._visiblePoints[pointIndex].text;
if (text == "DirectTotalCost")
text = "Direct";
else if (text == "MarkUpTotalCost")
text = "MarkUp";
else
text = "InDirect";
pieSeriesfunction(container, pieSeriesTitle, null, null, null, null, text);
}
else if (statusID != null)
pieSeriesfunction(container, pieSeriesTitle, ID, null, null, null, null);
else if (typeID != null)
pieSeriesfunction(container, pieSeriesTitle, null, ID, null, null, null);
else
pieSeriesfunction(container, pieSeriesTitle, ID);
}
SymbolID.style.visibility = "visible";
},
seriesRendering: function (sender) {
if (sender.model.series[0].name != seriesData.name)
CategoryID.style.visibility = "visible";
else
CategoryID.style.visibility = "hidden";
},
title: { text: maintitle },
size: { height: "600" },
legend:
{
visible: true,
position: 'right',
textOption: { font: { size: '20px' } },
itemSize: { height: 10, width: 10 }
}
});
if (CategoryID.addEventListener)
CategoryID.addEventListener('click', function () {
container.ejChart("option", { "drilldown": pieSeries(seriesData, maintitle, true) });
CategoryID.style.visibility = "hidden";
TextID.innerHTML = "";
SymbolID.style.visibility = "hidden";
}, false);
else
CategoryID.attachEvent('onclick', function () {
container.ejChart("option", { "drilldown": pieSeries(seriesData, maintitle, true) });
CategoryID.style.visibility = "hidden";
TextID.innerHTML = "";
SymbolID.style.visibility = "hidden";
}, false);
SIGN IN To post a reply.
5 Replies
DD
Dharanidharan Dharmasivam
Syncfusion Team
July 27, 2017 11:54 AM UTC
Hi Weam,
Thanks for contacting Syncfusion support.
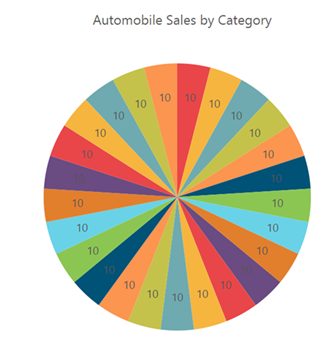
We have analyzed your query with the provided code snippet. We would like to let you know that, it is recommended approach to use data visualization component (Pie chart) when there are less than 20 to 25 points. Pie chart is not good solution for comparing more number of points. If there are more number of data (say for example 50 or 100), then the data label will not be clear and the chart will be clumsy in appearance. So, we recommend to use pie chart when there are less number of data, for more number of data you can use column/bar type series for better visualization. We have prepared a sample with 25 points and now drill down is working properly.
Screenshot before drill down:
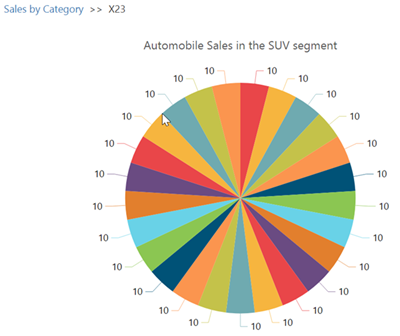
Screenshot after drill down:
Sample for reference can be find from below link.
Kindly revert us, if you have any other concerns.
Thanks,
Dharani.
WG
weam ghalab
July 27, 2017 12:11 PM UTC
Thanks for the reply and support
DD
Dharanidharan Dharmasivam
Syncfusion Team
July 28, 2017 04:26 AM UTC
WG
weam ghalab
July 31, 2017 10:07 AM UTC
this error appear when click on the category to get back to the original data without complete its circular animation how can i add the category/symbol/text after it complete rendering the data to prevent any interfere during it
Cannot read property 'id' of undefined
at Object.circularAnimationComplete (ej.chart.min.js:10)
at SVGPathElement.complete (ej.chart.min.js:10)
at SVGPathElement.d.complete (jquery-2.2.4.min.js:3)
at i (jquery-2.2.4.min.js:2)
at Object.fireWith [as resolveWith] (jquery-2.2.4.min.js:2)
at i (jquery-2.2.4.min.js:3)
at n.fx.tick (jquery-2.2.4.min.js:3)
DD
Dharanidharan Dharmasivam
Syncfusion Team
August 1, 2017 01:08 PM UTC
Hi Weam,
Thanks for your update.
We have analyzed your query. Find the response for your queries below.
| Queries | Response | |
| this error appear when click on the category to get back to the original data without complete its circular animation | We have tried to replicate the reported issue, but unfortunately the reported scenario is not occurred at our end. Sample used for testing can be find from below link. In the above sample after drill down and before animation completes, we have clicked on the category to go back to original data, its working properly at our end. Since we are not aware of your exact scenario, we would like to know the following details, which will be helpful in further analysis and provide you the solution sooner.
| |
| how can i add the category/symbol/text after it complete rendering the data to prevent any interfere during it | If you need to add symbol to the drill down chart, then you can achieve this using seriesRendering event of drill down chart and for text, you can use displayTextRendering event. In this event you can customize the text with respect to your requirement. We have prepared a sample in which on drill down we have changed the shape of data label and customized the text as depicted below. You can change this with respect to your scenario.
Screenshot before drill down: 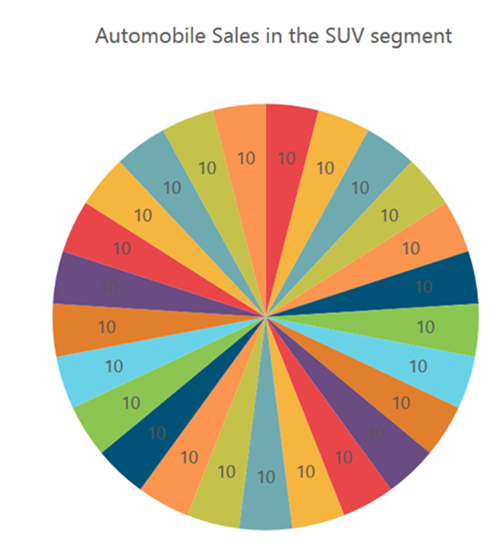 Screenshot after drill down: 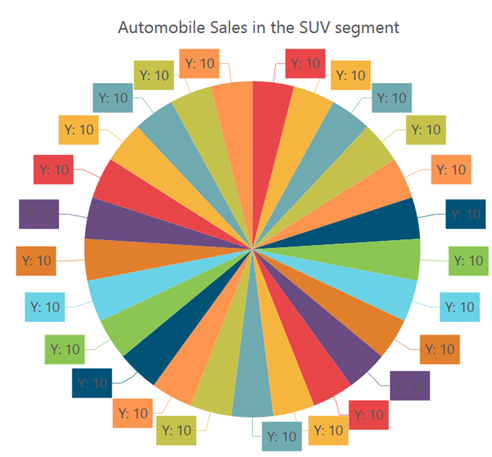 Sample for reference can be find from below link. |
Thanks,
Dharani.
SIGN IN To post a reply.
- 5 Replies
- 2 Participants
-
WG weam ghalab
- Jul 26, 2017 01:35 PM UTC
- Aug 1, 2017 01:08 PM UTC
