Not able to customize chart with Typescript code
Hi,
Attachment: Syncfusion_chart_issue_2832404.zip
I am not able to customize syncfusion chart in Typescript code. It was working earlier. I am using typescript version 2.2.0. My code is below,
$("#perfTrndChart").ejChart({
series: [{
dataSource: this.chartData,
xName: this.xAxisDataName,
yName: this.yAxisDataName,
fill: this.chartSeriesColor,
type: 'line',
marker: {
shape: 'circle',
visible: "true",
border:
{
color: "green"
}
},
tooltip:
{
visible: true,
format: " #series.name# <br/>Date Time : #point.x# <br/> Value : #point.y# ",
fill: "red"
}
}]
});
Is it because of typescript version? Its working if I declare this customization in html itself. For eg, declaring series type in
<e-series name="Trend Data" [dataSource]="chartData" xName="dateX" yName="valueY" type="line" ></e-series>
Please help me out.
Note:
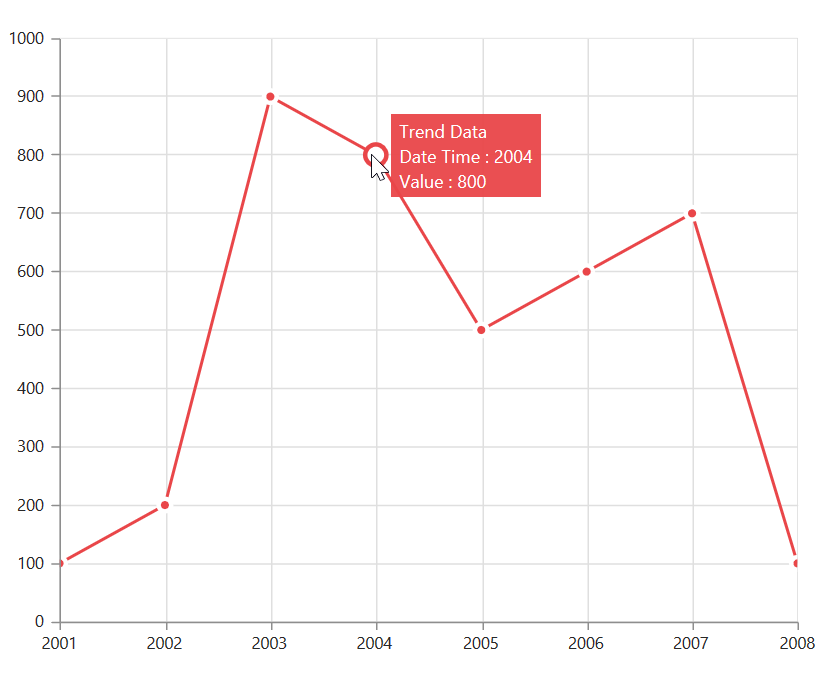
In attached image, you can see that, I have formatted my tooltip in typescript code. but its not shown in UI.
Attachment: Syncfusion_chart_issue_2832404.zip
SIGN IN To post a reply.
1 Reply
DD
Dharanidharan Dharmasivam
Syncfusion Team
May 1, 2017 06:31 AM UTC
Hi Selvaraj,
Thanks for contacting Syncfusion support.
We have analyzed your query with the provided code snippet and screenshot. We have prepared a sample and ensured with typescript version which you have mentioned. But unfortunately, we were not able to replicate your scenario. The tooltip is customized as specified in format of tooltip property. Find the code snippet below.
| Angular 2: <ej-chart> <e-seriescollection> <e-series tooltip.visible="true" tooltip.format="#series.name# <br/>Date Time : #point.x# <br/> Value : #point.y# "> </e-series> </e-seriescollection> </ej-chart> |
Screenshot:
Since you have provided code snippet in javascript, we have also attahced the sample in javascript. Find the sample with the below link.
Since we were not able to replicate your scenario, we would like to know the following details, which will be helpful in further analysis and provide you the solution sooner.
· Kinldy modify the attched sample or provide your project with replication steps.
· Browser with version in which the issue is reproduced.
· Essential studio version which you were using.
Thanks,
Dharani.
SIGN IN To post a reply.
- 1 Reply
- 2 Participants
-
SE Selvaraj
- Apr 28, 2017 01:29 PM UTC
- May 1, 2017 06:31 AM UTC
