- Home
- Forum
- ASP.NET MVC
- $("#chartPromedio").ejChart("instance") is not working
$("#chartPromedio").ejChart("instance") is not working
I want create a dynamic chart from grid data source.
In javascript section, when i want the chart instance,
var chart = $("#chartPromedio").ejChart("instance");
I give an error. I don't know why.
View
....
<div class="row">
<div class="col-md-12">
@(Html.EJ().Grid<EntitiesInforme.SP.InformeDiarioProcesado>("FlatGrid")
.Locale("es-ES")
.Datasource((IEnumerable<object>)ViewBag.DSInforme)
.SelectionType(SelectionType.Multiple)
.Mappers(map => map.ExportToExcelAction("Informes/ExcelExport"))
.ToolbarSettings(toolBar => toolBar.ShowToolbar().ToolbarItems(items =>
{
items.AddTool(ToolBarItems.ExcelExport);
}))
.AllowFiltering()
//.FilterSettings(filter => { filter.FilterType(FilterType.Excel); })
//.FilterSettings(filter => { filter.ShowFilterBarStatus().FilterBarMode(FilterBarMode.OnEnter); })
.FilterSettings(filter => { filter.FilterType(FilterType.Excel); })
.SummaryRow(row =>
{
row.Title("Total").SummaryColumns(col =>
{
col.SummaryType(SummaryType.Sum).DisplayColumn("Rango0").DataMember("Rango0").Add();
col.SummaryType(SummaryType.Sum).DisplayColumn("Rango1").DataMember("Rango1").Add();
col.SummaryType(SummaryType.Sum).DisplayColumn("Rango2").DataMember("Rango2").Add();
col.SummaryType(SummaryType.Sum).DisplayColumn("Rango3").DataMember("Rango3").Add();
col.SummaryType(SummaryType.Sum).DisplayColumn("Rango4").DataMember("Rango4").Add();
col.SummaryType(SummaryType.Sum).DisplayColumn("Rango5").DataMember("Rango5").Add();
col.SummaryType(SummaryType.Sum).DisplayColumn("Rango6").DataMember("Rango6").Add();
col.SummaryType(SummaryType.Sum).DisplayColumn("Rango7").DataMember("Rango7").Add();
//col.SummaryType(SummaryType.Sum).DisplayColumn("TotalDias").DataMember("TotalDias").Add();
col.SummaryType(SummaryType.Sum).DisplayColumn("PromedioDias").DataMember("PromedioDias").Add();
col.SummaryType(SummaryType.Sum).DisplayColumn("OperacionesSuperioresLimite").DataMember("OperacionesSuperioresLimite").Add();
col.SummaryType(SummaryType.Sum).DisplayColumn("Total").DataMember("Total").Add();
}).Add();
})
.AllowTextWrap()
.AllowSorting()
.AllowPaging()
.AllowScrolling()
.AllowGrouping()
.GroupSettings(group => { group.EnableDropAreaAnimation(true); group.ShowDropArea(true); })
.Columns(col =>
{
col.Field("CodigoOS").HeaderText("Tipo").TextAlign(TextAlign.Center).Add();
col.Field("CodigoCentro").HeaderText("Centro").Add();
col.Field("Contrata").HeaderText("Contrata").Width(120).Add();
col.Field("Rango0").HeaderText("<= 4 días").TextAlign(TextAlign.Center).Add();
col.Field("Rango1").HeaderText("5-10 días").TextAlign(TextAlign.Center).Add();
col.Field("Rango2").HeaderText("11-20 días").TextAlign(TextAlign.Center).Add();
col.Field("Rango3").HeaderText("21-30 días").TextAlign(TextAlign.Center).Add();
col.Field("Rango4").HeaderText("31-40 días").TextAlign(TextAlign.Center).Add();
col.Field("Rango5").HeaderText("41-50 días").TextAlign(TextAlign.Center).Add();
col.Field("Rango6").HeaderText("51-60 días").TextAlign(TextAlign.Center).Add();
col.Field("Rango7").HeaderText("> 60 días").TextAlign(TextAlign.Center).Add();
//col.Field("TotalDias").HeaderText("Total días").TextAlign(TextAlign.Center).Add();
col.Field("PromedioDias").HeaderText("Promedio Dias").TextAlign(TextAlign.Center).Width(90).Add();
col.Field("OperacionesSuperioresLimite").HeaderText("Op. Sup. Límite").TextAlign(TextAlign.Center).Width(90).Add();
col.Field("Total").TextAlign(TextAlign.Center).Add();
})
.ClientSideEvents(eve =>
{
eve.RowSelected("onRowSelected");
eve.ActionComplete("onActionComplete");
})
)
</div>
</div>
<div class="row">
<div class="col-md-12">
@(Html.EJ().Chart("chartSelected")
.Legend( x => x.Visible(false))
)
</div>
<div class="col-md-12">
@(Html.EJ().Chart("chartPromedio")
.Legend(x => x.Visible(false))
)
</div>
</div>
@section scripts
{
<script type="text/javascript">
var data;
var len = 0;
var selectedData = [];
var SeriesDataSources = [];
onActionComplete = function (sender) {
var data = sender.model.currentViewData;
var chart = $("#chartPromedio").ejChart("instance");
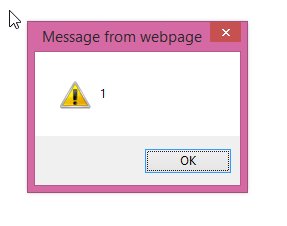
alert("1");
................
alert("1") is not show
Thank you
<!DOCTYPE html>
<html>
<head>
<meta charset="utf-8" />
<meta name="viewport" content="width=device-width, initial-scale=1.0">
<title>@ViewBag.Title - Control de Operaciones y Gestión de Campaña</title>
<link rel='nofollow' href="~/Content/ej/web/default-theme/ej.widgets.all.min.css" rel="stylesheet" />
<script src="~/Scripts/jquery-1.10.2.min.js"></script>
<script src="~/Scripts/jquery.easing.1.3.min.js"></script>
<script src="~/Scripts/jsrender.min.js"></script>
<script src="~/Scripts/jquery.globalize.min.js"></script>
<script src="~/Scripts/globalize/cultures/globalize.culture.es-ES.js"></script>
<script src="~/Scripts/ej/ej.web.all.min.js"></script>
<script src="~/Scripts/ej/ej.unobtrusive.min.js"></script>
@Styles.Render("~/Content/css")
@Scripts.Render("~/bundles/modernizr")
</head>
<body>
<div class="navbar navbar-inverse navbar-fixed-top">
<div class="container" id="banner">
<div class="container">
<h1 id="Title">Control de Operaciones y Gestión de Campaña</h1>
</div>
</div>
<div class="container">
<div class="navbar-header">
<button type="button" class="navbar-toggle" data-toggle="collapse" data-target=".navbar-collapse">
<span class="icon-bar"></span>
<span class="icon-bar"></span>
<span class="icon-bar"></span>
</button>
@*@Html.ActionLink("Application name", "Index", "Home", new { area = "" }, new { @class = "navbar-brand" })*@
</div>
<div class="navbar-collapse collapse">
<ul class="nav navbar-nav">
<li>@Html.ActionLink("Home", "Index", "Home", new { area = "" }, null)</li>
<li>@*@Html.ActionLink("Informes Diarios", "Index", "InformeDiario", new { Area = "Informes" }, null)*@</li>
<li class="dropdown">
<a rel='nofollow' href="#" class="dropdown-toggle" data-toggle="dropdown" role="button" aria-haspopup="true" aria-expanded="false">Informes <span class="caret"></span></a>
<ul class="dropdown-menu">
<li>@Html.ActionLink("Informes Diarios", "Index", "InformeDiario", new { Area = "Informes" }, null)</li>
<li>@Html.ActionLink("Informes Semanal", "Index", "InformeSemanal", new { Area = "Informes" }, null)</li>
</ul>
</li>
</ul>
</div>
</div>
</div>
<br />
<br />
<div class="container body-content">
@RenderBody()
<hr />
<footer>
<p>© @DateTime.Now.Year - Control de Operaciones y Gestión de Campaña</p>
</footer>
</div>
@Html.EJ().ScriptManager()
@Scripts.Render("~/bundles/bootstrap")
@RenderSection("scripts", required: false)
</body>
</html>
catching the exception y get this error:

We have analyzed your query and replicated the scenario in our sample. In the View page of the sample chart instance is created before the chart plugin has been created. So only following error message has been created.
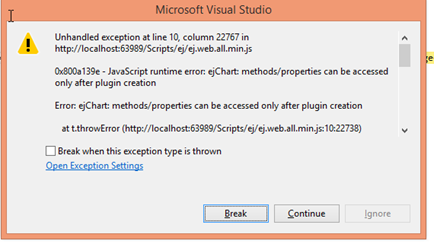
To overcome this we have to add the chart before the grid plugin has been created. Please find the below code snippet.
<div>
@(Html.EJ().Chart("container").Size(sz => sz.Height("400").Width("1000"))
.Legend(lgn => lgn.Visible(false))
)
</div>
<div style="width:1000px;height:400px">
<br /><br />
@(Html.EJ().Grid<WebApplication1.Controllers.CountriesSalesData>("FlatGrid")
.Datasource((IEnumerable<object>)ViewBag.datasource)
.AllowFiltering()
.AllowPaging()
.EnableHeaderHover()
.ClientSideEvents(c => c.ActionComplete("completeAction"))
.FilterSettings(filter => { filter.FilterType(FilterType.Excel); })
.Columns(col =>
{
col.Field("TransactionID").HeaderText("TransactionID").Width(100).Add();
col.Field("CategoryName").HeaderText("CategoryName").Width(120).Add();
col.Field("SalesAmount").HeaderText("SalesAmount").Width(140).Format("{0:C2}").Add();
col.Field("ShipDate").HeaderText("ShipDate").Width(140).Add();
})
)
</div>
<script type="text/javascript">
var data;
completeAction = function (sender) {
var data = sender.model.currentViewData;
var chart = $("#container").ejChart("instance");
alert("1");
chart.model.series[0].dataSource = data;
chart.model.series[0].xName = "CategoryName",
chart.model.series[0].yName = "SalesAmount",
chart.redraw();
}
</script>
In the above code grid has been created after the chart plugin is added.
Please find the below screenshot
Please let us know if you have any queries.
Regards,
Sanjith K.?
I set the chart before the grid, and I get the same error.
I attach a simplified project. You need run Areas/Informes/InformeSemanal/Index
Anyway, I need set the chart after the grid, so, How I can resolve this error?
Thanks
Attachment: Web_ControlOperaciones_42558ab5.zip
Sorry for the inconvenience caused. We have analyzed your query and created the sample by placing the chart before the grid. Sample is working fine without any issue.
Please find the sample below.
Sample link: https://www.syncfusion.com/downloads/support/forum/119897/ze/WebApplication1531921422
If you are still facing any issue, please revert us back by modifying the attached sample as per your scenario along with the replication procedure.
Regards,
Sanjith K.?
We have analyzed your query and created the sample as per your requirement.
In the sample we have added the grid before the chart. The problem with your requirement is that you are trying to access the chart element before it was created, so we can achieve this using a work around by using ChartLoad event. We have created a variable to find whether the chart is loaded in the page so that the data from the grid can be loaded after creating chart. In sample we have initially declared ischartLoad is false. ischartLoad is set as true once the chart is rendered and then we can get the instance of the chart as usually in the onActionComplete. Please find the below code snippet.
var ischartLoad = false;
function chartLoad(sender) {
ischartLoad = true;
sender.model.series[0].dataSource = grid.model.currentViewData;
sender.model.series[0].xName = "categoryName";
sender.model.series[0].yName = "salesAmount";
}
onActionComplete = function (sender) {
var data = sender.model.currentViewData;
if (ischartLoad) {
var chart = $("#chartPromedio").ejChart("instance");
chart.model.series[0].dataSource = sender.model.currentViewData;
chart.redraw();
}
else {
grid = sender;
}
}
In the above code for the render the chart we have used the data in the currentVIewData. Using this we can get the number of columns equal to the number of data in the grid’s page.
Screenshot before filtering

Screenshot after filtering

Please find the sample from the below location
Sample link: http://www.syncfusion.com/downloads/support/forum/119931/ze/WebApplication1826640165
Regards,
Sanjith K.
I've been out.
Thanks for your update
Please let us know if you need further assistance.
Thanks,
Vinothkumar Arumugam.
- 9 Replies
- 3 Participants
-
MA Manolo
- Aug 11, 2015 02:36 PM UTC
- Aug 31, 2015 10:40 AM UTC
