Hi Kalpa,
Thanks for using Syncfusion product.
We have analyzed this. Range to the date time axis can be set by specifying as like the below mentioned format.
| [CSHTML] @(Html.EJ().Chart("container") .PrimaryXAxis(xaxis=>xaxis.Range(ra=>ra.Min(new DateTime(2009,12,30)) .Max(new DateTime(2010,12,1)).Interval(1)))) |
Since date time axis is of linear type, interval for this can be of days / months/ years / hours / seconds / minutes / milliseconds (i.e. any date time unit). This can be specified in sample by setting the below property.
| [CSHTML] @(Html.EJ().Chart("container") .PrimaryXAxis(xaxis=>xaxis .IntervalType(ChartIntervalType.Years))) |
The below shows a simple date time axis chart which takes interval as years
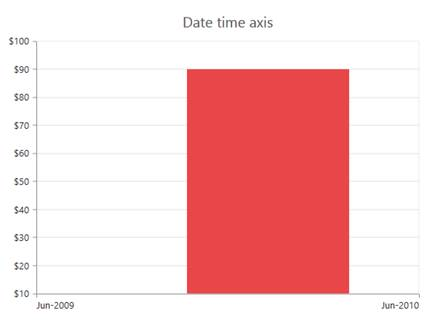
Sample code:
@(Html.EJ().Chart("container")
.PrimaryXAxis(xaxis=>xaxis.ValueType(AxisValueType.Datetime)
.LabelFormat("MMM-yyyy")
.Range(ra=>ra.Min(new DateTime(2009,6,1) ).Max(new DateTime(2010,6,1)).Interval(1))
.IntervalType(ChartIntervalType.Years)
.EdgeLabelPlacement(EdgeLabelPlacement.Shift)))
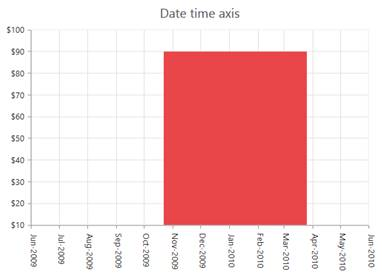
The below shows a date time axis chart in which interval in calculated based on months
We have also made a sample to illustrate this. Find it from the below location.
MvcApplication47.zip
Kindly refer the below link for more details regarding this
Link: https://help.syncfusion.com/ug/js/documents/datetimeaxis.htm
Please let us know if you have any concern.
Thanks,
Jayavigneshwaran
