100% Stacked Column Chart in Essential Studio® Flutter
Overview
The Flutter 100% Stacked Column Chart displays multiple series of data as stacked columns, ensuring that the cumulative proportion of each stacked element always totals 100%. Thus, the y-axis will always render within the range 0–100. This chart type is best suited for depicting the relative contribution of data points. You can create beautiful, animated, real-time and high-performance 100% stacked column chart that also supports the interactive features such as zooming and panning, trackball, crosshair, tooltip and selection.

Key features

Stacking group
Group a series with another series using the group name in the Flutter 100% Stacked Column Chart. Group the series with different stacking name separately.
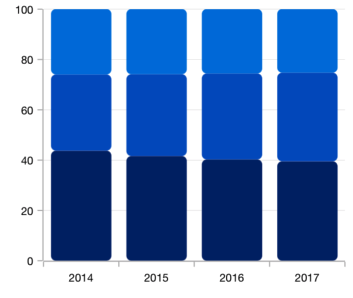
Rounded corners
Modernize the UI by applying the rounded corners to the Flutter 100% Stacked Column Chart.

Spacing and width
The 100% Stacking Column Chart provides an option to customize the spacing between two rectangle.
Learning resources


Flutter Stacked Column Chart User Guide
Learn available options to customize the Flutter stacked column chart.
