Spline Chart in Essential Studio® Flutter
Overview
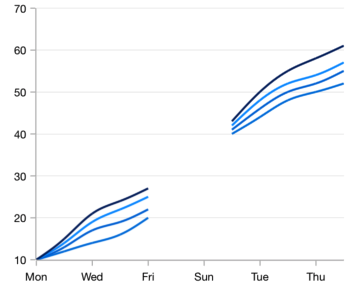
The Flutter Spline Chart resembles a line chart, but the difference between them is that instead of connecting the data points with straight lines, the data points are connected by smooth Bezier curves. You can create beautiful, animated, real-time and high-performance spline chart that also supports the interactive features such as zooming and panning, trackball, crosshair, tooltip and selection.

Key features

Spline type
Four different types of rendering such as natural, monotonic, cardinal, and clamped.

Vertical rendering
Rotate the Flutter Spline Chart to plot data in a vertical direction and view data from a different perspective.
Empty points
Empty or null data points are elegantly handled in the Flutter spline chart.

Marker
Marks data points with built-in shapes such as circles, rectangles, ellipses, vertical lines, horizontal lines, diamonds, triangles, and pentagons. In addition to these shapes, use images to make the point more attractive.

Multiple axes
Use multiple axes to plot different data sets that widely vary from one other.


