Flutter Pie Chart - Create Easy-to-Use, Beautiful Pie Chart
Overview
The Flutter Pie Chart is a circular graphic, which is ideal for displaying proportional values in different categories. You can create beautiful, animated, real-time and high-performance pie chart that also supports the interactive features such as explode, tooltip and selection.

Key features

Explode on touch
Explode a slice in the pie chart to differentiate it from other slices.

Semi pie
Configure the semi pie to visualize data in a different perspective and reduce the size of the rendering area.
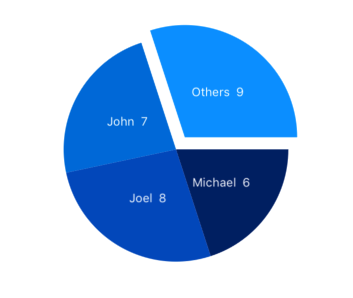
Grouping
Group smaller segments in the Flutter Pie Chart to a single segment called “others”.

Customization
Customize the look and feel of the Flutter Pie Chart using built-in APIs.

Smart labels
Arranges data labels smartly to avoid overlapping when the data point values fall in close range.
Code example
Easily get started with the Flutter Pie Chart using a few simple lines of DART code example as demonstrated below,
import 'package:flutter/material.dart';
import 'package:syncfusion_flutter_charts/charts.dart';

@override
    Widget build(BuildContext context) {
        final List<ChartData> chartData = [
            ChartData('David', 25),
            ChartData('Steve', 38),
            ChartData('Jack', 34),
            ChartData('Others', 52)
        ];
        return Scaffold(
            body: Center(
                child: Container(
                    child: SfCircularChart(
                        series: <CircularSeries>[
                            // Render pie chart
                            PieSeries<ChartData, String>(
                                dataSource: chartData,
                                pointColorMapper:(ChartData data, _) => data.color,
                                xValueMapper: (ChartData data, _) => data.x,
                                yValueMapper: (ChartData data, _) => data.y
                            )
                        ]
                    )
                )
            )
        );
    }

    class ChartData {
        ChartData(this.x, this.y, [this.color]);
        final String x;
        final double y;
        final Color? color;
    }

