Overview
The Flutter Line Chart represents and visualizes time-dependent data to show the trends at equal intervals. It supports numeric, category, date-time, or logarithmic axis of a graph. You can create beautiful, animated, real-time and high-performance line chart that also supports the interactive features such as zooming and panning, trackball, crosshair, tooltip and selection.

Key features
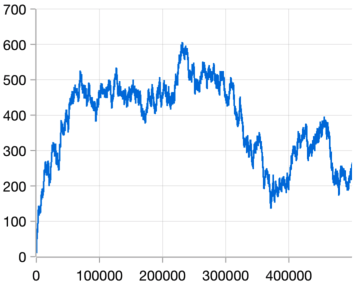
Fast line
Displays thousands of data within a few seconds. Experience smooth interactions.

Empty point
Empty or null data points are elegantly handled in the Flutter Line Chart.
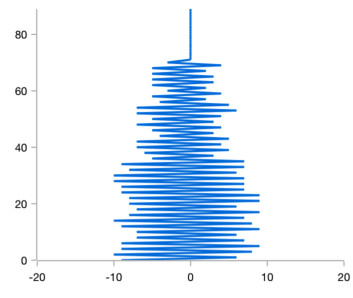
Vertical line
Rotate the Flutter Line Chart to plot data in a vertical direction and view data from a different perspective.

Marker
Marks data points with built-in shapes such as circles, rectangles, ellipses, vertical lines, horizontal lines, diamonds, triangles, and pentagons. In addition to these shapes, use images to make the point more attractive.

Multiple axes
Use multiple axes to plot different data sets that widely vary from one other.
Code example
Easily get started with the Flutter Line Chart using a few simple lines of DART code example as demonstrated below,
import 'package:flutter/material.dart';
import 'package:syncfusion_flutter_charts/charts.dart';

@override
    Widget build(BuildContext context) {
        final List<SalesData> chartData = [
            SalesData(2010, 35),
            SalesData(2011, 28),
            SalesData(2012, 34),
            SalesData(2013, 32),
            SalesData(2014, 40)
        ];

        return Scaffold(
            body: Center(
                child: Container(
                    child: SfCartesianChart(
                        primaryXAxis: DateTimeAxis(),
                        series: <CartesianSeries>[
                            // Renders line chart
                            LineSeries<SalesData, DateTime>(
                                dataSource: chartData,
                                xValueMapper: (SalesData sales, _) => sales.year,
                                yValueMapper: (SalesData sales, _) => sales.sales
                            )
                        ]
                    )
                )
            )
        );
    }

    class SalesData {
        SalesData(this.year, this.sales);
        final DateTime year;
        final double sales;
    }

