Overview
The Flutter Area Chart is like a line chart that represents time-dependent data and shows the trends at equal intervals, but it fills the area. It can be configured with numeric, category, or date time axis for the graph. You can create beautiful, animated, real-time and high-performance area chart that also supports the interactive features such as zooming and panning, trackball, crosshair, tooltip and selection.

Key features
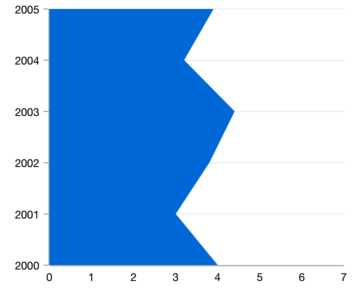
Vertical chart
Rotate the Flutter area chart to plot data vertically and view data from a different perspective.
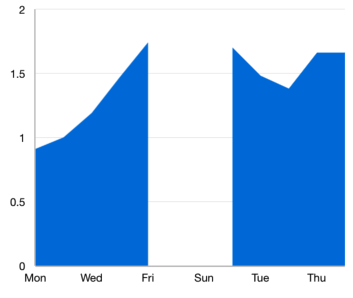
Empty or null data point
The Flutter area chart handles empty or null data points elegantly.
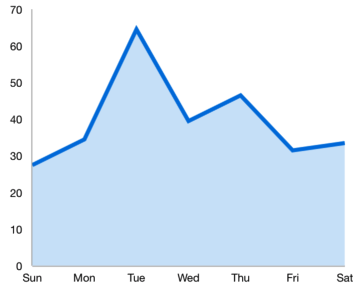
Customization
Customize the color and border of the Flutter Area Chart using the built-in APIs to make it visually unique.
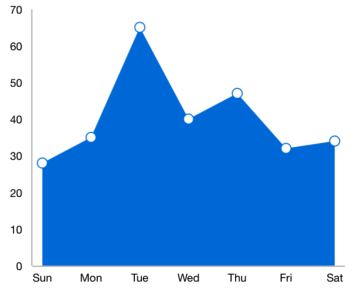
Marker
Marks data points with built-in shapes such as circles, rectangles, vertical lines, horizontal lines, diamonds, triangles, inverted triangles and pentagons. In addition to these shapes, use images to make the point more attractive.

Multiple axes
Use multiple axes to plot different data sets along two or more axes having different data points and values.
Code example
Easily get started with the Flutter Area Chart using a few simple lines of DART code example as demonstrated below,
import 'package:flutter/material.dart';
import 'package:syncfusion_flutter_charts/charts.dart';

void main() {
  return runApp(_ChartApp());
}

class _ChartApp extends StatelessWidget {
  @override
  Widget build(BuildContext context) {
    return MaterialApp(
      theme: ThemeData(primarySwatch: Colors.blue),
      home: _MyHomePage(),
    );
  }
}

class _MyHomePage extends StatefulWidget {
  // ignore: prefer_const_constructors_in_immutables
  _MyHomePage({Key? key}) : super(key: key);

  @override
  _MyHomePageState createState() => _MyHomePageState();
}

class _MyHomePageState extends State<_MyHomePage> {
  late List<_ChartData> data;
  late TooltipBehavior _tooltip;

  @override
  void initState() {
    data = [
      _ChartData('CHN', 12),
      _ChartData('GER', 15),
      _ChartData('RUS', 30),
      _ChartData('BRZ', 6.4),
      _ChartData('IND', 14)
    ];
    _tooltip = TooltipBehavior(enable: true);
    super.initState();
  }

  @override
  Widget build(BuildContext context) {
    return Scaffold(
        appBar: AppBar(
          title: const Text('Syncfusion Flutter chart'),
        ),
        body: SfCartesianChart(
            primaryXAxis: CategoryAxis(),
            primaryYAxis: NumericAxis(minimum: 0, maximum: 40, interval: 10),
            tooltipBehavior: _tooltip,
            series: <CartesianSeries<_ChartData, String>>[
              AreaSeries<_ChartData, String>(
                  dataSource: data,
                  xValueMapper: (_ChartData data, _) => data.x,
                  yValueMapper: (_ChartData data, _) => data.y,
                  name: 'Gold',
                  color: Color.fromRGBO(8, 142, 255, 1))
            ]));
  }
}

class _ChartData {
  _ChartData(this.x, this.y);

  final String x;
  final double y;
}

