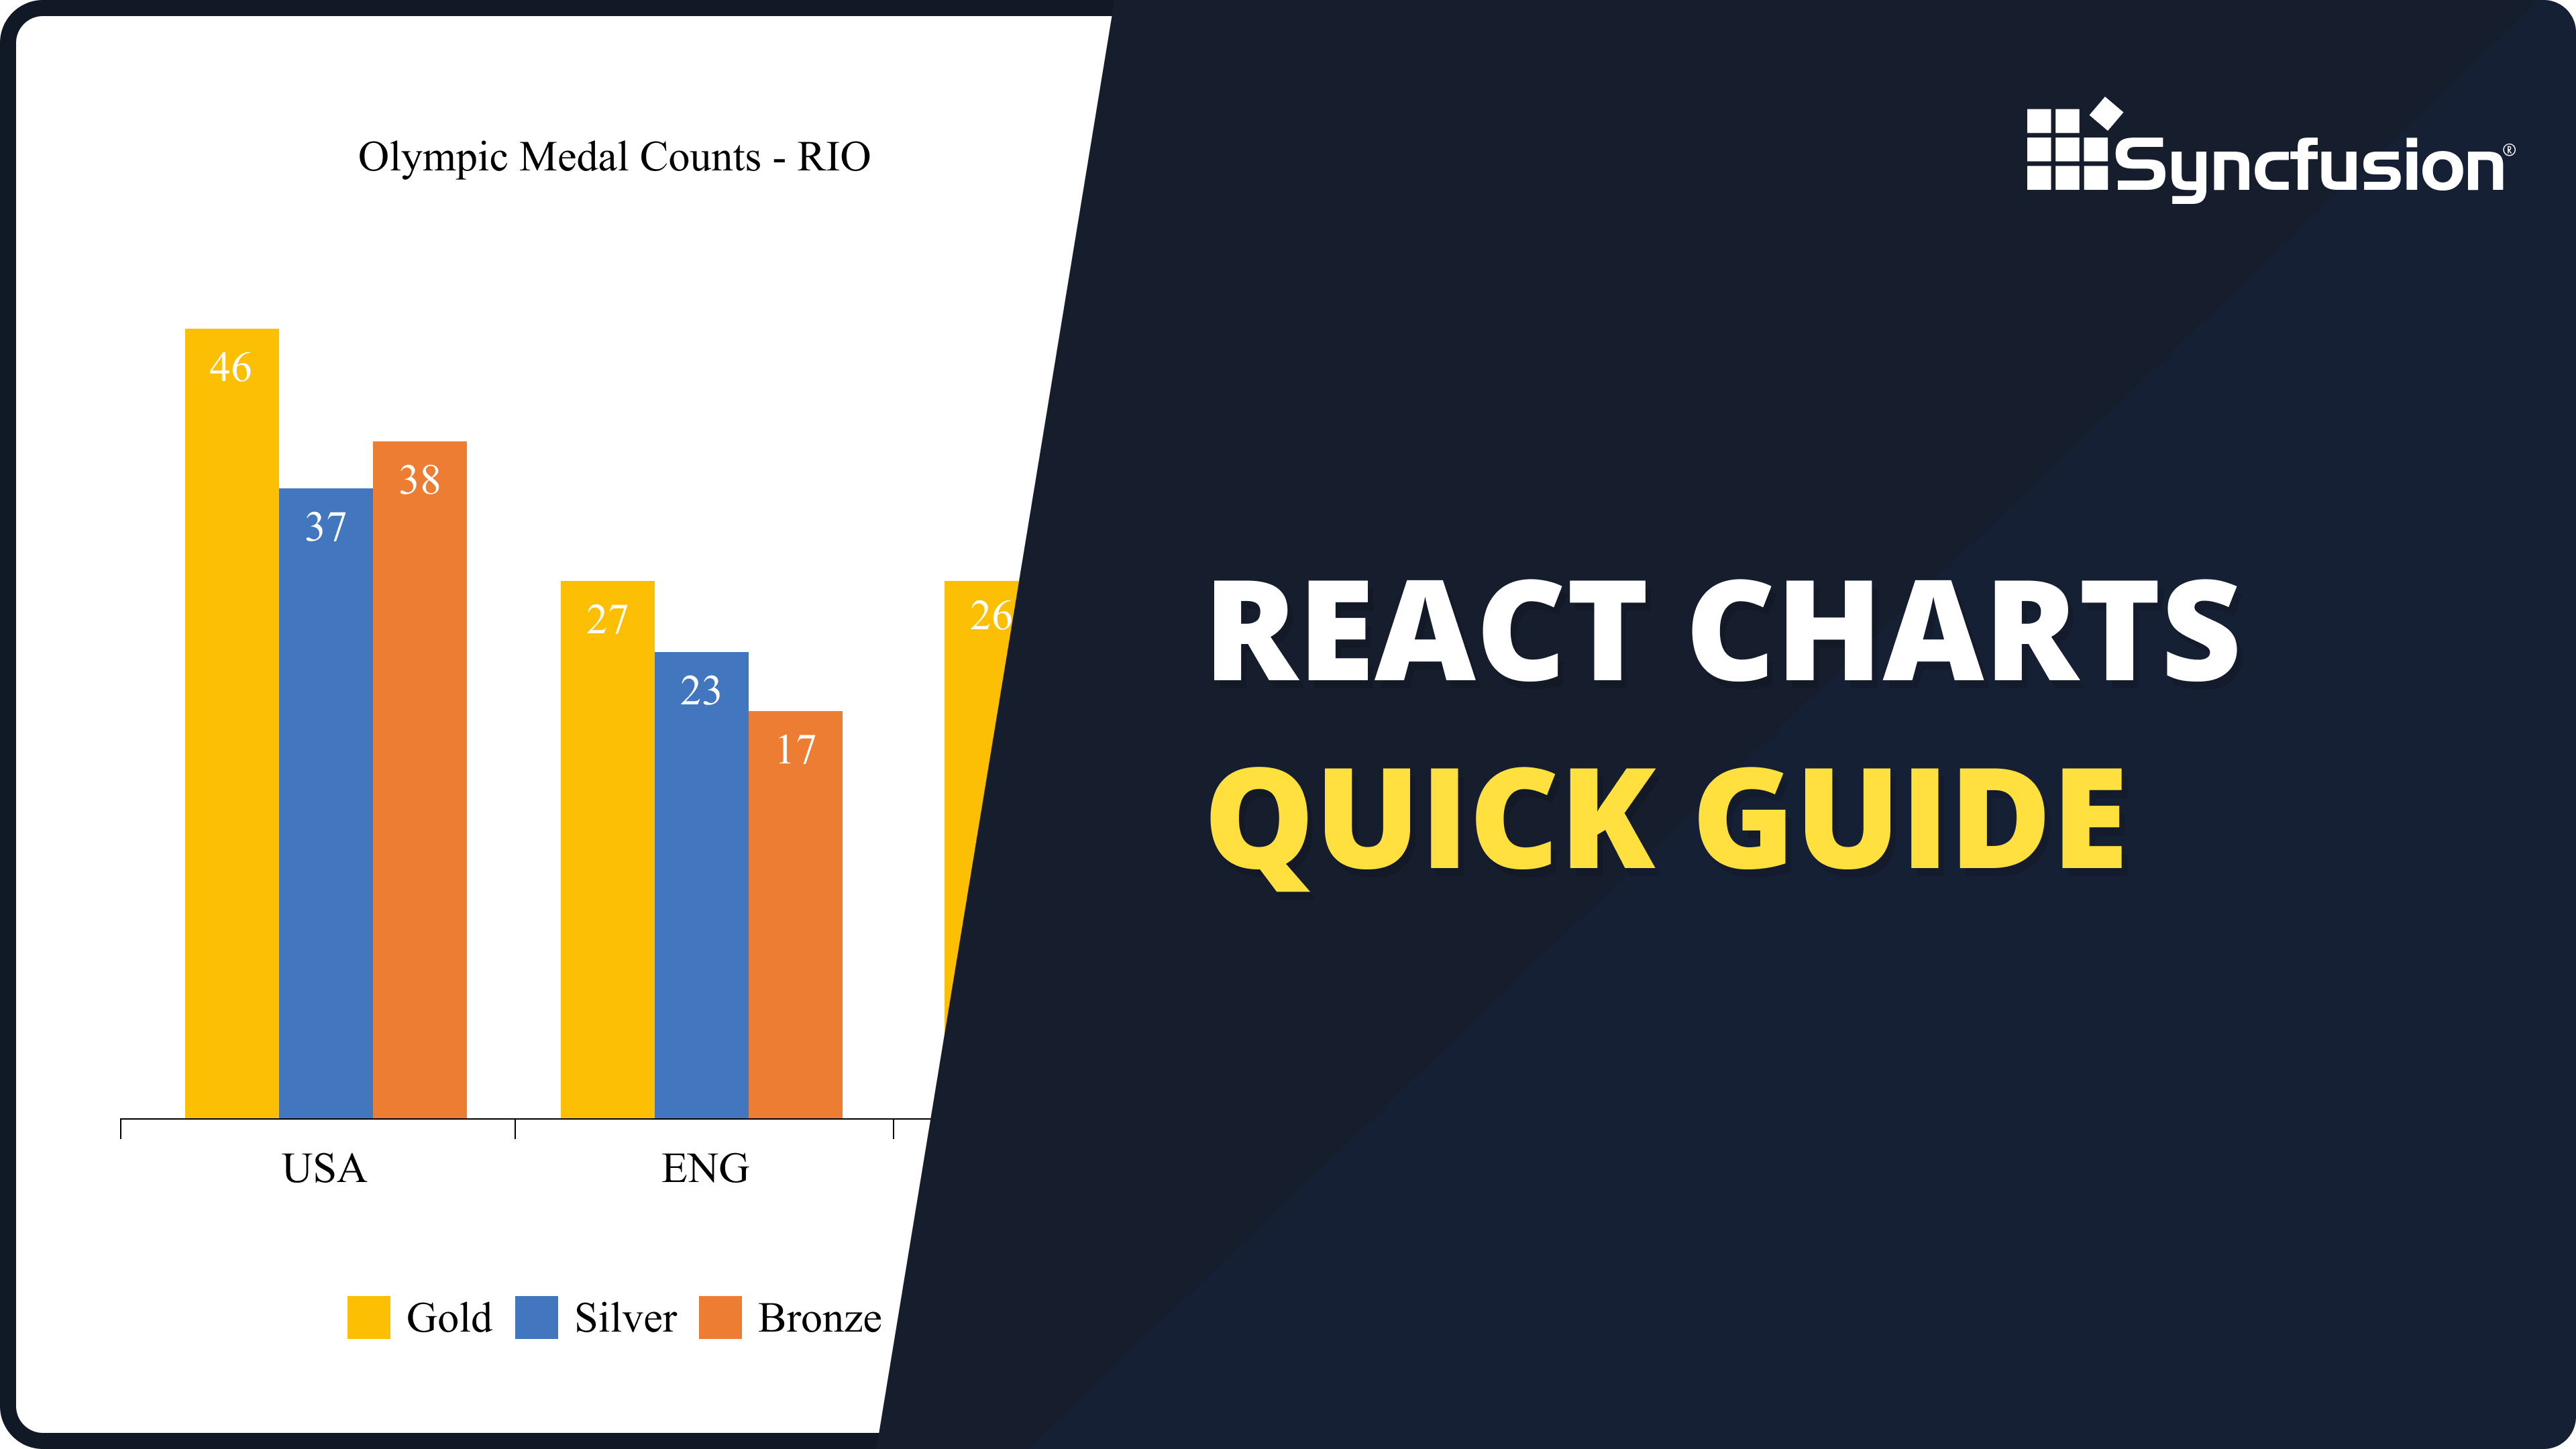
Build elegant, high-performance charts in React from a collection of 55+ chart types. Seamlessly integrates into your app with responsive design, smooth animations, and cross-browser support.
The React Charts component is a powerful, interactive data visualization library designed for modern React applications. It supports 55+ chart types, real-time data updates, zooming, panning, tooltips, and high-performance rendering, even with large datasets. Built for flexibility and speed, it integrates seamlessly into any React project and works flawlessly across all modern browsers and devices.
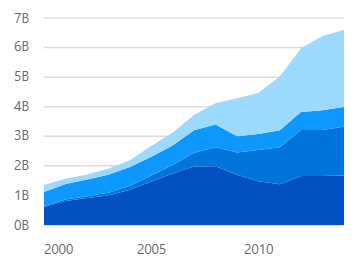
High-Performance Charts
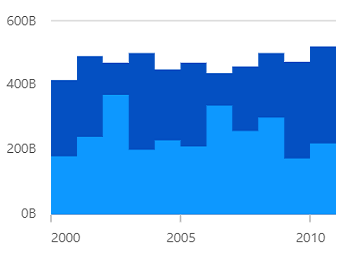
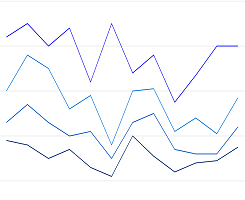
Syncfusion® React Charts is built for high-performance data visualization. Effortlessly render 100K+ data points with smooth interactions and zero lag. Ideal for big data dashboards, scientific analysis, and enterprise-grade applications that demand speed and scalability.
Why choose Syncfusion® React Charts?
Syncfusion® React Charts offers a developer-first experience with seamless React integration, intuitive APIs, and blazing-fast rendering. With support for 55+ chart types, responsive layouts, and real-time updates, it empowers you to build data-rich interfaces that scale effortlessly across devices and platforms.
Visualize live data streams with Syncfusion® React Charts. Perfect for dashboards and monitoring systems, its charts deliver smooth transitions and instant updates for dynamic, real-time data visualization.
React Chart Getting Started Video
Explore the full potential of Syncfusion React Charts in this comprehensive walkthrough. Learn how to set up charts, choose from 55+ chart types, and unlock advanced features like live data updates, zooming, and responsive layouts. Whether you're building dashboards or data-driven apps, this video will help you get started quickly and confidently.
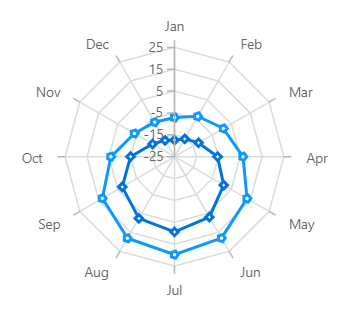
You can add custom elements to the chart by using the annotations option.
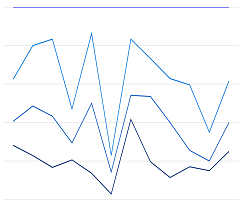
When displaying data on several charts, synchronized charts enhance visualization by coordinating tooltips, crosshairs, selections, and zooming features across all charts.
Flexible data binding with support to use local and remote data sources such as JSON, RESTful services, OData services, and WCF services.
One of the best React Charts in the market that offers feature-rich UI to interact with the software.
No, this is a commercial product and requires a paid license. However, a free community license is also available for companies and individuals whose organizations have less than $1 million USD in annual gross revenue, 5 or fewer developers, and 10 or fewer total employees.
Having an excellent set of tools and a great support team, Syncfusion® reduces customers’ development time. Here are some of their experiences.
Everything works perfect, examples are great and support team tries to do their best to help
Support and amount of tutorials. They help a lot to understand the basics, of what syncfusion can suggest. I use Data Grids, Charts. It has a good design too. It’svery good.
Arnoldas A,
Junior Node.JS Developer
Best Mobile Chart Solution for Flutter - most professional and responsive engineering and support
Syncfusion Team is World Class! - We discovered a problem implementing the Syncfusion Charts, Submitted a support ticket - immediate response & help. The Engineers confirmed the problem - and immediately started creating a new version that fixed the problem, they kept in contact with me - in a few days, the new version was ready and it works flawlessly. If you are looking for a team that will support you and work with your DEV team rapidly and responsively - then Syncfusion is for you. Best charting solution for mobile (we are using the Flutter plug-ins) - works great on the latest IOS & Android Builds - very customizable - great training and support - We highly recommend Syncfusion for the products & equally the customer & dev support. Very pleasant to work with as well 😉
Don M,
Owner/Developer
Awards
Greatness—it’s one thing to say you have it, but it means more when others recognize it.Syncfusion® is proud to hold the following industry awards.