
Google Maps API Succinctly®

CHAPTER 4
Adding Data to the Map
So far, we have played around with the basic appearance of the map and the various controls we can use to interact with it. Now, it’s time for us to start adding our own data to the map and making it our own.
Google calls the graphics that are presented on top of the base map overlays. In this chapter, we’ll consider the different overlays that are available and give you access to a tool written specifically for this book that will make creating simple map graphics…well, simple.
We will cover:
- Markers
- Info windows
- Shapes: lines, circles, rectangles, and polygons
- Ground overlays
- KML layers and GeoRSS
- User-generated data
Adding markers
The simplest overlay we can show on the map is a marker. A marker represents a single point on the map, defined by a latitude/longitude coordinate (referred to as a LatLng in this book) and represented by an icon. Markers are typically used to show the location of points of interest, such as a business, address, and so on.
Like many other elements in the Google Maps API, a marker consists of a class that you need to instantiate to create the marker (google.maps.Marker), and an object literal that you pass to it that lets you configure its appearance and behavior (google.maps.MarkerOptions).
To create a marker, you must specify at a minimum its position (LatLng) property and the map that it should appear on. This is done by setting properties on the MarkerOptions object. You can optionally specify many other properties, including title (for rollover text) and icon (if you want to use an icon other than Google’s iconic pushpin).
Copy Ch2_FirstMap.html to a new file called Ch4_SimpleMarker.html and enter the code in Code Listing 10 to place a marker at the location of Big Ben in London.
Code Listing 10: Adding a marker to the map
<script> // The code to create the map goes here. function initMap() { var mapOptions = { center: new google.maps.LatLng(51.503, -0.135), zoom: 12 }; var map; map = new google.maps.Map(document.getElementById('map'), mapOptions); var marker = new google.maps.Marker({ position: new google.maps.LatLng(51.510357, -0.116773), map: map, title: "Big Ben" }); } </script> |
All we’re doing in this code is creating a new instance of the google.maps.Marker class and setting its position, map, and title properties. When we open the page in a browser, the standard Google Maps marker icon appears, showing the location of Big Ben.

Figure 16: Marker showing the location of Big Ben
Tip: If you want to define your marker but then have it appear later, perhaps in response to the user doing something, then leave out the map property value assignment. When you are ready to display the marker, call marker.setMap(map) instead. To remove the marker from the map, call marker.setMap(null).
Labelling the marker
When you move the mouse over the marker, the text you entered in the marker’s title property appears as a tooltip. But perhaps you’d like some clue as to what the marker represents on the marker icon itself. Add the label property assignment to the code that creates the marker, as shown in Code Listing 11.
Code Listing 11: Setting the label property on the marker
<script> // The code to create the map goes here. function initMap() { var mapOptions = { center: new google.maps.LatLng(51.503, -0.135), zoom: 12 }; var map; map = new google.maps.Map(document.getElementById('map'), mapOptions); var marker = new google.maps.Marker({ position: new google.maps.LatLng(51.510357, -0.116773), map: map, title: "Big Ben", label: "B" }); } </script> |

Figure 17: Labelling the marker.
Changing the marker icon
Suppose we don’t like the standard icon? Perhaps we are displaying several different markers and want our users to be able to easily distinguish among the types of features they represent based on their appearance. We can supply our own via the icon property. First, remove the label property you added earlier (it won’t show up very well on the icon), and then specify the location of the custom icon, as shown in Code Listing 12.
Code Listing 12: Marker with custom icon
<script> // The code to create the map goes here. function initMap() { var mapOptions = { center: new google.maps.LatLng(51.503, -0.135), zoom: 12 }; var map; map = new google.maps.Map(document.getElementById('map'), var marker = new google.maps.Marker({ position: new google.maps.LatLng(51.510357, -0.116773), map: map, title: "Big Ben", icon: "images/big-ben.png" }); } </script> |
![]()
Figure 18: Custom Big Ben icon.
Animating the marker
Maybe you think that the marker still doesn’t draw the user’s attention sufficiently. Why not animate it? Modify Ch4_IconMarker.html by adding an animation property to the marker with a value of google.maps.Animation.DROP. Enjoy the effect when you reload the page.
Code Listing 13: "Dropping" the icon on the map
<script> // The code to create the map goes here. function initMap() { var mapOptions = { center: new google.maps.LatLng(51.503, -0.135), zoom: 12 }; var map; map = new google.maps.Map(document.getElementById('map'), mapOptions); var marker = new google.maps.Marker({ position: new google.maps.LatLng(51.510357, -0.116773), map: map, title: "Big Ben", icon: "images/big-ben.png", animation: google.maps.Animation.DROP }); } </script> |
Still not obvious enough for you? Try changing the animation property value to google.maps.Animation.BOUNCE and enjoy the show!
Moving the marker
Maybe it’s not the appearance of the marker that bothers you, as much as its location. Set the marker’s draggable property to true, and you’ll be able to drag the marker to a new position on the map.
Click the marker to select it, keep the left mouse button down, and drag it across the map. Release the mouse button when you are satisfied with the new location (if you’re working with the Big Ben marker, please put it back where you found it after you have finished experimenting: we Brits will be mightily displeased if one of our most famous monuments suddenly disappears!).
Note: There are many other options for configuring the display of markers that we have not covered here. Consult the reference documentation for more ideas.
Info windows
So far, we have a little tooltip that displays information about our marker when the user hovers the mouse cursor over it. That’s okay for tiny amounts of information, but sometimes you want to show more. That’s where an info window comes in.
An info window is like a speech bubble in a comic book. The main area shows your chosen content and there is a tapered stem that anchors itself to a geographic point on the map.
Markers are good things to attach info windows to, because a single geographic coordinate defines them. If you wanted to attach an info window to a polygon (more on that later), then you would need to find a point within that polygon (typically the center point) to which to anchor it.
You can include pretty much any content you like within the info window, including text, HTML, or a DOM element. Once you have created an instance of InfoWindow and configured its appearance within an associated InfoWindowOptions object, then you have to figure out a way to trigger its display. Usually this is in response to a user action, like clicking the associated marker.
Let’s add an info window to our Big Ben marker, to show users more information about this iconic London landmark. Start by copying Ch4_IconMarker.html to a new file called Ch4_InfoWindow.html. You’ll need to add some CSS to the <style> tag and change the initMap() function, as shown in Code Listing 14.
Code Listing 14: Adding an Info Window
<!DOCTYPE html> <html> <head> <title>Ch4 Info Window</title> <meta name="viewport" content="initial-scale=1.0"> <meta charset="utf-8"> <style> #map { height: 100%; } html, body { height: 100%; margin: 0; padding: 0; } .iwContent { width: 300px; } .iwHeader { font-family: "verdana"; font-weight: bold; font-size: 2em; color: blue; } .iwBody { font-family: "arial"; font-size: 1em; } .iwImage { float: left; padding: 5px; } </style> </head> <body> <div id="map"></div> <script> var strContent = "<div class='iwContent'><div class='iwHeader'>Big Ben</div>" + "<img class='iwImage' src='images/big-ben-iw.jpg'/>" + "<div class='iwBody'<p>Big Ben is the nickname for the Great Bell of the clock at the north end of the Palace of Westminster in London.</p>" + "<p>It is usually extended to refer to both the clock and the clock tower.</p>" + "<p><a href='https://en.wikipedia.org/wiki/Big_Ben'>Wikipedia</a></p></div>"; function initMap() { var mapOptions = { center: new google.maps.LatLng(51.503, -0.135), zoom: 12 }; var map; map = new google.maps.Map(document.getElementById('map'), mapOptions); var infowindow = new google.maps.InfoWindow({ content: strContent }); var marker = new google.maps.Marker({ position: new google.maps.LatLng(51.510357, -0.116773), map: map, title: "Big Ben", label: "B" }); marker.addListener('click', function () { infowindow.open(map, marker); }); } </script> <!-- Reference the API --> <script src="https://maps.googleapis.com/maps/api/js?key=[YOUR API KEY]" async defer></script> </body> </html> |
In Code Listing 14, the following code creates the InfoWindow and sets the content to be the HTML fragment we stored in the strContent variable:
var infowindow = new google.maps.InfoWindow({
content: strContent
});
The following code adds an event listener to the marker’s click event:
marker.addListener('click', function () {
infowindow.open(map, marker);
});
When the user clicks on the marker, the info window displays at the coordinates of the marker, as shown in Figure 19.
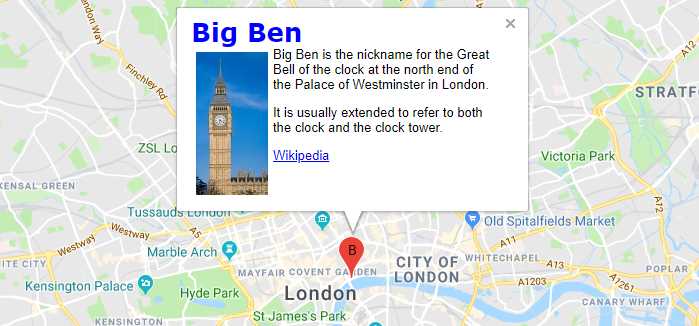
Figure 19: Info Window.
The fact that we’re associating this info window with a marker makes positioning the info window doubly easy. We can just pass the marker itself as the second parameter to the infowindow.open([map, anchor]) function, and the Google Maps API will figure it out. Sometimes, however, you’ll want to use an info window for something else, in which case you’ll need to set the position property of the info window before calling infowindow.open() to display it. You can do this either in the InfoWindowOptions object:
var infowindow = new google.maps.InfoWindow({
content: strContent
position: new google.maps.LatLng(-34, 151)
});
Or specify the position at runtime by calling setPosition(LatLng):
infoWindow.setPosition(new google.maps.LatLng(-34, 151));
Adding shapes
If you want to display a county boundary or the path of a winding river, then the humble marker won’t cut it. You need a shape. The difference between a shape and a marker is that a marker is a single, one-dimensional geographic coordinate, whereas a shape occupies 2D space.
The Google Maps API supports the following shapes:
- Polyline
- Polygon
- Circle
- Rectangle
In this section, we’ll add all these shapes to our map. Start by copying Ch2_FirstMap.html to a new file called Ch4_Shapes.html.
The Overlay Creator tool
Since it can be laborious to work out the geographic coordinates that define a shape, I have created a tool that will let you draw the shapes you want on a map and generate the code to represent that shape in the API. You can see a screenshot of the tool in action in Figure 20.

Figure 20: The Overlay Creator application.
Note: You can access the Overlay Creator tool here.
To use the Overlay Creator application:
- Select a tool from the Drawing Toolbar at the top of the map and draw the overlay you want (marker, polyline, polygon, circle, or rectangle).
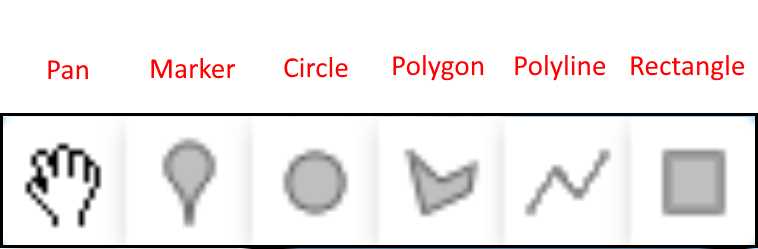
Figure 21: The Drawing Toolbar
- Each overlay is given a numerical label that corresponds to a button in the left-hand pane.
- Click the button for any overlay to generate the code that creates that overlay in the right-hand pane.
- Copy the generated code into your application, making any necessary changes to variable names. For example, the Overlay Creator assumes that your google.maps.Map object is called map, and will give an error if your map is called something else, like myMap.
- Clear the map canvas at any time by clicking Clear Overlays.
Polylines
A polyline is a collection of connected line segments, defined by an array of LatLng objects.
Use the Overlay Creator application to create the polyline. First, zoom the focus of the map on London in the United Kingdom.
Next, select the Polyline tool and click a point on the map where you want to start your line. Move the cursor to another location and click again. Repeat two or three more times to create a meandering line, and then double-click the final location to complete the line.
Then, click the button that corresponds to the label on the line you just created. This will populate the code area. Copy and paste that code into the Ch4_Shapes.html file at the bottom of the initMap function, as demonstrated in Code Listing 15.
Code Listing 15: Adding a polyline
<script> // The code to create the map goes here. function initMap() { var mapOptions = { center: new google.maps.LatLng(51.503, -0.135), zoom: 12 }; var map; map = new google.maps.Map(document.getElementById('map'), mapOptions); var polyLinePath = [ { lat: 51.52013885206369, lng: -0.17030430061413426 }, { lat: 51.526120070846396, lng: -0.17905903083874364 }, { lat: 51.530178307607414, lng: -0.1677293799598374 }, { lat: 51.53455652579403, lng: -0.1747674964149155 }, { lat: 51.53647853735119, lng: -0.1761407874305405 }, { lat: 51.54331169894711, lng: -0.1747674964149155 } ]; new google.maps.Polyline({ path: polyLinePath, map: map }); } </script> |
In Code Listing 15, we have a variable called polyLinePath that stores an array of latitude/longitude pairs. We then create an instance of google.maps.Polyline and set the path property in the PolylineOptions object to refer to that array. Just like a marker, the polyline needs to be associated with a google.maps.Map object before it will display, and we make that association by setting the map property of the PolylineOptions object.
Open the page in a browser to verify that your polyline matches the one that you created in the Overlay Creator, as shown in Figure 22.

Figure 22: The polyline added to the map.
We haven’t specified any symbology, so the polyline uses the default symbology, which is a bit dark and sinister-looking. Let’s change that by setting some more options on the PolylineOptions object:
- strokeColor is a hexadecimal HTML color of the format "#FFFFFF".
- strokeOpacity is a numerical value between 0.0 (fully transparent) and 1.0 (fully opaque) that determines the opacity of the line's color. The default is 1.0.
- strokeWeight is the width of the line in pixels.
For example, the settings in Code Listing 16 result in a polyline that looks like the one shown in Figure 23.
Code Listing 16: Specifying custom line symbology
new google.maps.Polyline({ path: polyLinePath, map: map, strokeColor: "#0000FF", strokeOpacity: 0.5, strokeWeight: 5 }); |
The result is a fatter, blue polyline that is partially transparent.

Figure 23: Polyline with custom symbology.
Polygons
A polygon is very similar to a polyline, in that it is defined by a path that contains an array of latitude/longitude pairs. The major difference, however, is that the polygon encloses an area, so the first point in the path is the same as the last. Note that you do not have to specify the last point: because you are creating an instance of google.maps.Polygon, the API infers that for you.
Create a polygon using the Overlay Creator tool. Click points on the map to create a vertex and double-click the last point to close the polygon. Paste the generated code into Ch4_Shapes.html underneath the polyline that you created earlier.
Because the polygon encloses an area, we have access not only to the strokeColor, strokeOpacity, and strokeWeight properties that define the outline (or perimeter) of the polygon, but also fillColor and fillOpacity. Set different values for these properties until you’re happy with the results.
Code Listing 17: The code to create a polygon
var polyPath = [ { lat: 51.5355175417175, lng: -0.1574296973426499 }, { lat: 51.534129401093, lng: -0.1624078772742905 }, { lat: 51.53060546938201, lng: -0.16549778205944676 }, { lat: 51.52708126487564, lng: -0.1608629248817124 }, { lat: 51.523877205867315, lng: -0.15657139045788426 }, { lat: 51.524411231359004, lng: -0.1514215491492905 }, { lat: 51.52547926355398, lng: -0.1457567237098374 }, { lat: 51.531139415963985, lng: -0.1464433692176499 }, { lat: 51.53573109805619, lng: -0.1485033057410874 }, { lat: 51.53679886472031, lng: -0.152108194657103 } ]; new google.maps.Polygon({ path: polyPath, map: map, strokeColor: "#FF2222", strokeOpacity: 1.0, strokeWeight: 3, fillColor: "#21212C", fillOpacity: 0.3, }); |
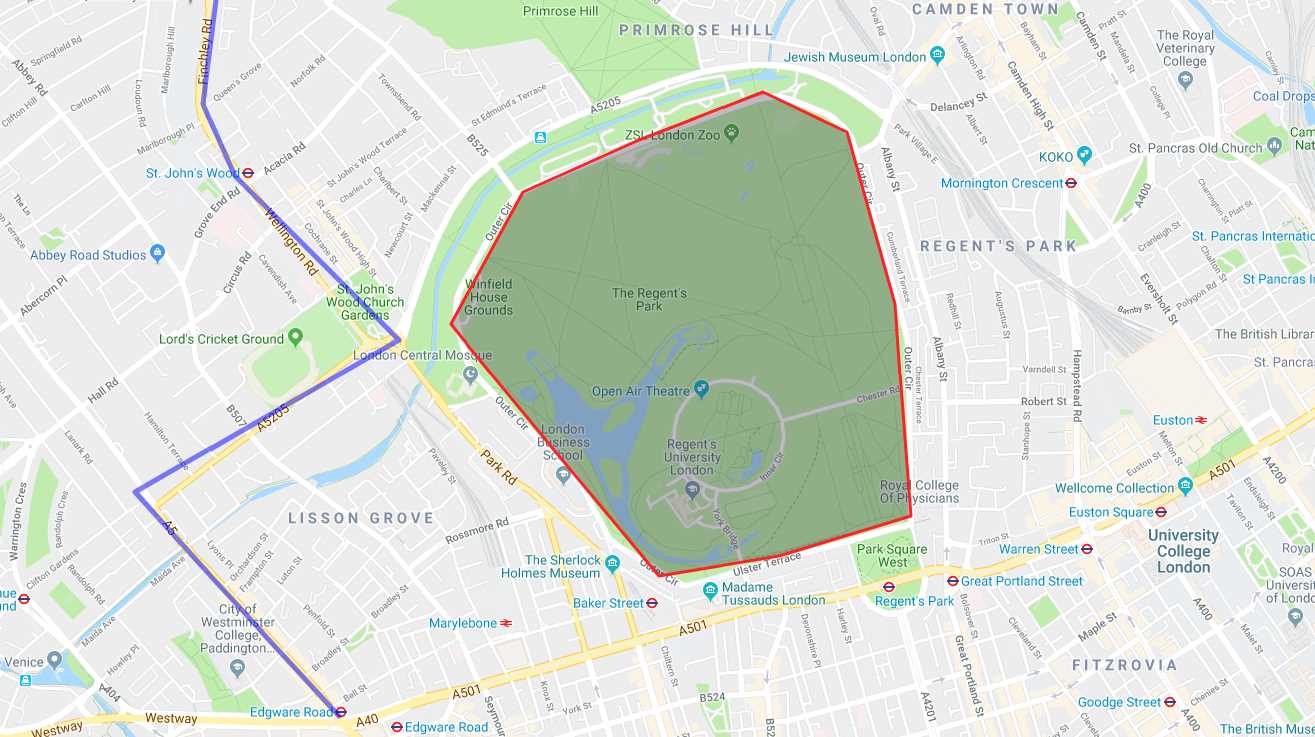
Figure 24: The polygon added to the map.
Circles
A center point and a radius define a circle. Because a circle encloses an area, we can symbolize it in exactly the same way as a polygon.
Use the Overlay Creator to create a circle. Select the circle tool and click on the map where you want the center of the circle to be. Hold down the left mouse button while moving the mouse cursor and release it when the circle is the size you want it to be.
Code Listing 18: Adding a circle
|
center: new google.maps.LatLng(51.52126039042774, -0.15931797248913426), radius: 537.1837860475924, strokeColor: "#00FF00", strokeOpacity: 0.9, strokeWeight: 2, fillColor: "#4286F4", fillOpacity: 0.5, map: map }); |

Figure 25: The circle added to the map.
Rectangles
A rectangle is a special type of polygon with four sides at 90-degree angles. You create a google.maps.Rectangle object by specifying the bounds property in its associated RectangleOptions object. The bounds are the location of the rectangle’s corners. They can be specified either as individual points:
bounds: {
north: 33.685,
south: 33.671,
east: -116.234,
west: -116.251
}
Or as a google.maps.LatLngBounds object. A LatLngBounds object defines a rectangular area based on the points at its southwest and northeast corners. This is the approach that the Overlay Creator tool uses, as shown in Code Listing 19.
Code Listing 19: Adding a rectangle using LatLngBounds
var rectBounds = new google.maps.LatLngBounds( //southwest corner new google.maps.LatLng(51.525319060321756, -0.1443834326942124), //northeast corner new google.maps.LatLng(51.52937736847714, -0.13391208870007176) ); new google.maps.Rectangle({ bounds: rectBounds, strokeColor: "#4242f4", strokeOpacity: 1.0, strokeWeight: 4, fillColor: "#F4F141", fillOpacity: 0.6, map: map }); |

Figure 26: The rectangle added to the map.
Editing and moving shapes
You saw earlier how you could move a marker by setting its draggable property to true. You can do this with the other shapes, too.
Furthermore, you can edit a shape by setting its editable property to true, or calling setEditable() on the shape. Try this with the polygon you added earlier.
In Code Listing 20, I’m using setEditable(). To do this, I must first assign the polygon to a variable, which I call myPoly.
Code Listing 20: Making a polygon editable
var myPoly = new google.maps.Polygon({ path: polyPath, map: map, strokeColor: "#FF2222", strokeOpacity: 1.0, strokeWeight: 3, fillColor: "#21212C", fillOpacity: 0.3, }); myPoly.setEditable(true); |
When you make an overlay editable in this way, a little point appears at each vertex, as shown in Figure 27. You can drag any of these points to change the shape. A little Undo button appears at each vertex you manipulated, so that you can revert to the previous position if you want to.
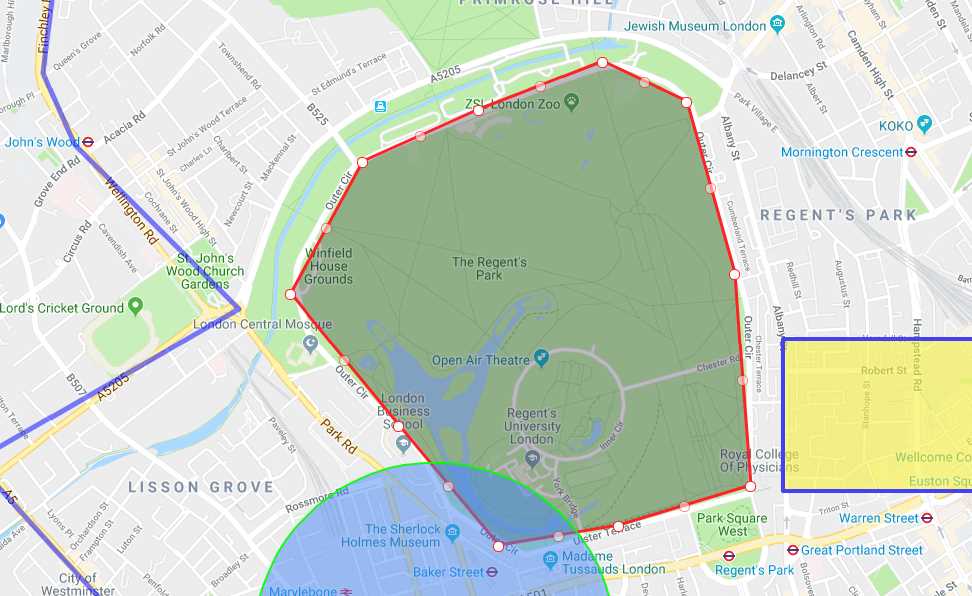
Figure 27: An editable polygon
Ground overlays
So far in this chapter, we’ve only looked at vector graphics and not images. You can add an image to the map in the form of a ground overlay that, like all other overlays, is geographically referenced and moves with the map. This can be useful to show things like historical map data, or different satellite imagery for a specific area.
In this example, we’re going to use a ground overlay to show the floor plan at 10, Downing Street in London, where the British prime minister resides.
First, copy Ch2_FirstMap.html to a new file called Ch4_GroundOverlay.html. Then, change the map extent to focus on the Downing Street area in London and add the code that creates the ground overlay, as shown in Code Listing 21, changing the link to the image if necessary.
Code Listing 21: Creating a ground overlay
|
var mapOptions = { center: new google.maps.LatLng(51.50334151281109, -0.1273725998895543), zoom: 19 }; var map; map = new google.maps.Map(document.getElementById('map'), mapOptions); // southwest and northeast corners where the image should be placed. var imageBounds = new google.maps.LatLngBounds( new google.maps.LatLng(51.503260954928486, -0.12832746629885605), new google.maps.LatLng(51.503729273890755, -0.1272773814695256) ); var historicalOverlay = new google.maps.GroundOverlay( "images/downing-street.gif", imageBounds); historicalOverlay.setMap(map); } |
When you open the page in the browser, you should see the floor plan appear as shown in Figure 28 and be able to zoom and pan around as if it was part of the map. Which, because you have georeferenced it, it is!

Figure 28: Floor plan of 10 Downing St., using a ground overlay.
KML and GeoRSS
KML and GeoRSS are common methods used to share geographic data. Since you're likely to find a lot of geographic datasets in these formats, you'll want to know how to use them in your Google Maps API applications.
KML stands for Keyhole Markup Language. It is an XML-based markup language specifically for geographic data and is widely used in Google Earth. The "keyhole" part of the name came from the company that originally developed Google Earth, before Google acquired it.
GeoRSS is a way of encoding geographic features as part of a web feed in the same way that your blog feed reader does.
The process for using either KML or GeoRSS is identical. Non-intuitively, the KmlLayer class handles both, rendering them into a Google Maps API overlay.
Creating a KmlLayer object is as simple as passing the URL of the GeoRSS feed or KML file to the google.maps.KmlLayer constructor.
For our first example, we’re going to use a GeoRSS feed provided by the USGS (United States Geological Survey), which shows earthquake data for the past 30 days for all earthquakes with a magnitude of 4.5 and above.
The feed we’re going to use is located here.
If you visit that link, you can see the raw feed data, which looks like Figure 29.

Figure 29: Extract of the USGS earthquake GeoRSS feed.
Copy Ch2_FirstMap.html to a new file called Ch4_GeoRSS.html, and amend the initMap function as shown in Code Listing 22.
Code Listing 22: Adding the GeoRSS earthquakes feed
function initMap() { var mapOptions = { center: new google.maps.LatLng(51.503, -0.135), zoom: 12 }; var map; map = new google.maps.Map(document.getElementById('map'), mapOptions); var georssLayer = new google.maps.KmlLayer({ url: "https://earthquake.usgs.gov/earthquakes/feed/v1.0/summary/4.5_month.atom", }); georssLayer.setMap(map); } |
When you open the page in the browser, you’ll see something a bit like Figure 30. It won’t be identical, as this is a live feed.

Figure 30: Live earthquake data from USGS
What just happened? The extent of the map in the MapOptions object has been completely ignored and the map automatically expands to show all the points in the KmlLayer. This is the default behavior. If you want to stop this from happening, you can set preserveViewport: true in the KmlLayerOptions object.
Also, what’s with those funky blue markers? When you consume a GeoRSS feed or KML file, you’re basically getting what the author intended to show you, using the symbology they defined. You’re stuck with it, basically!
Let’s try and load KML using the same technique. I’ve got a sample KML file you can use here.
Tip: Make sure the KML file you want to load is at a publicly available URL, and not on your local machine. Otherwise, it won’t load.
Copy the Ch4_GeoRSS.html file to Ch4_Kml.html. Change the code that reads the GeoRSS layer to read the KML file instead, as shown in Code Listing 23.
Code Listing 23: Reading a KML file
function initMap() { var mapOptions = { center: new google.maps.LatLng(51.503, -0.135), zoom: 12 }; var map; map = new google.maps.Map(document.getElementById('map'), mapOptions); var kmlLayer = new google.maps.KmlLayer({ url: "http://marklewin.github.io/gmaps/kml/cities.kml" }); kmlLayer.setMap(map); } |
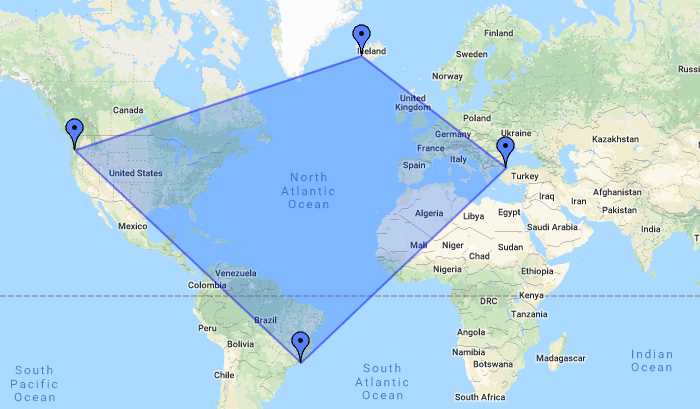
Figure 31: The KML file, displayed on the map
In case you’re interested in what the contents of the KML file look like, see Code Listing 34. Note that KML uses a simple, XML-based syntax for encoding geographic features. Each feature is defined in a <Placemark> tag and has a <name> and a geometry which, in our example, is either <Point> or <Polygon>.
Code Listing 24: The cities.kml file
<?xml version="1.0" encoding="utf-8"?> <kml xmlns="http://www.opengis.net/kml/2.2"> <Document> <Placemark> <name>Portland</name> <Point> <coordinates>-122.681944,45.52,0</coordinates> </Point> </Placemark> <Placemark> <name>Rio de Janeiro</name> <Point> <coordinates>-43.196389,-22.908333,0</coordinates> </Point> </Placemark> <Placemark> <name>Istanbul</name> <Point> <coordinates>28.976018,41.01224,0</coordinates> </Point> </Placemark> <Placemark> <name>Reykjavik</name> <Point> <coordinates>-21.933333,64.133333,0</coordinates> </Point> </Placemark> <Placemark> <name>Simple Polygon</name> <Polygon> <outerBoundaryIs> <LinearRing> <coordinates>-122.681944,45.52,0 -43.196389,-22.908333,0 28.976018,41.01224,0 -21.933333,64.133333,0 -122.681944,45.52,0</coordinates> </LinearRing> </outerBoundaryIs> </Polygon> </Placemark> </Document> </kml> |
There is a lot of KML available on the web. Search for useful and interesting KML files by specifying the filetype:kml option in the Google search dialog box.
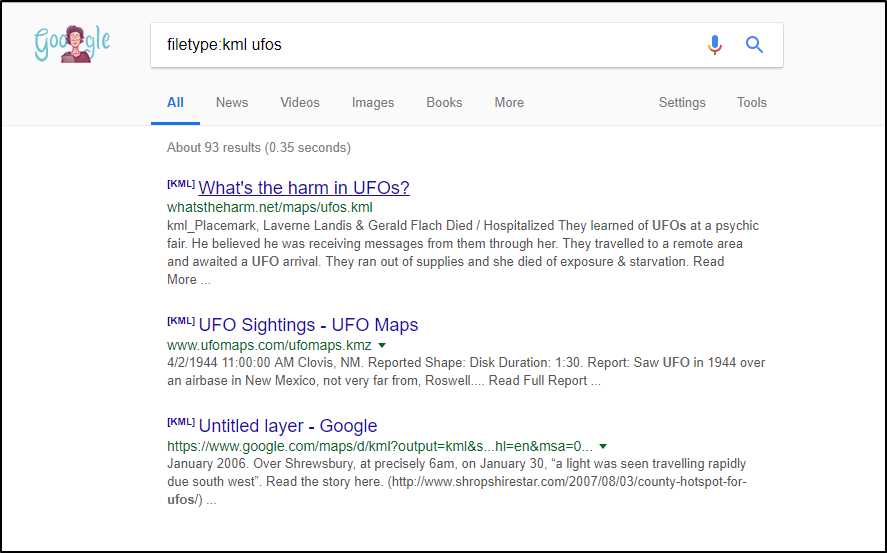
Figure 32: Searching for KML files using Google.
Tip: Learn to create your own KML files by reading Google’s KML tutorial here.
Getting your users to do the work
So far, we’ve forced users to see our overlays. But what if we want users to create their own? This could have several potential uses. For example, we might be building an application for local citizens to report instances of unlawful garbage disposal. Our users would click the map at the location where they have observed unlawful rubbish disposal and fill in a quick form, and we would submit this to a database so that the administrators and subsequent users of the application could also see this on the map. Or, we might want to allow our users to create temporary overlays as inputs to other operations, such as drawing a polygon to define an area of interest.
Thankfully, we don’t have to write the code for this ourselves. Google has anticipated this requirement and given us the Drawing Library to make adding this functionality a snap.
If you have used the Overlay Creator tool, then you have already seen the Drawing Tool in action. Essentially, it adds a toolbar to your application that includes any or all the tools shown in Figure 33.

Figure 33: The Drawing Toolbar.
A word about libraries
The Drawing Library is not part of the core Google Maps API. It’s a library and, as such, needs to be requested separately. Google packages some functionality in this way to make the core API much quicker to download. Not every application will require drawing capability, so why force those that don’t require it to download and parse all the required code? However, it’s a fair bet that a Google Maps API application will require a map and overlays, so it makes sense to include that sort of stuff in the core API.
Table 1 lists the libraries that are available.
Table 1: Google Maps JavaScript API Libraries
Library | Description |
|---|---|
drawing | Provides a graphical interface for users to draw polygons, rectangles, polylines, circles, and markers on the map. |
geometry | Provides utility functions for calculating scalar geometric values (such as distance and area) on the surface of the Earth. |
places | Enables your application to search for places such as businesses, geographic locations, or prominent points of interest, within a defined area. |
visualization | Enables your application to create heat maps to show the density of data. |
Tip: We only cover the Drawing Library in this book, but it’s well worth checking out the others here.
To use a library within your application, you specify a library parameter in your bootstrap URL and provide a comma-separated list of the libraries you require. For example, to request the drawing and geometry libraries, you would use a bootstrap URL in the following format:
<script src="https://maps.googleapis.com/maps/api/js?key=[YOUR_API_KEY]
&callback=initMap&libraries=drawing,geometry"></script>
Adding the Drawing Manager
If you want to follow along, start by copying Ch2_FirstMap.html to create a new file called Ch4_Drawing.html.
Change the initial map extent to display the world at a smaller scale:
var mapOptions = { center: new google.maps.LatLng(15.5, 10.5), zoom: 3 };
Then, request the drawing library in the bootstrap URL and create an instance of google.maps.drawing.DrawingManager. Call setMap() on the DrawingManager object to tell the toolbar which map to appear on. Your code should look similar to that shown in Code Listing 25.
Code Listing 25: Adding the drawing library and creating the DrawingManager
<body> <div id="map"></div> <script> function initMap() { var mapOptions = { center: new google.maps.LatLng(15.5, 10.5), zoom: 3 }; var map; map = new google.maps.Map( document.getElementById('map'), mapOptions); var drawingManager = new google.maps.drawing.DrawingManager(); drawingManager.setMap(map); } </script> <!-- Reference the API --> <script src="https://maps.googleapis.com/maps/api/js?key=[YOUR API KEY]&callback=initMap&libraries=drawing" async defer></script> </body> |
That’s all it takes to add drawing capability to your application. Open the page in a browser and experiment with the different tools available.
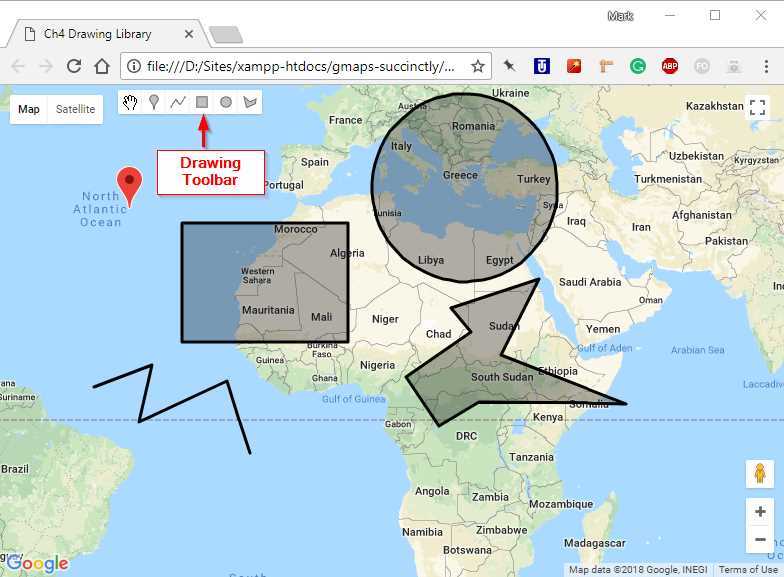
Figure 34: The Drawing Toolbar in action.
Let’s tweak things a little to demonstrate how to configure the Drawing Manager. First, we want the control to be in the top center of the map. Second, we only want the marker, polyline, and polygon tools—we don’t want our users to draw rectangles or circles. The default drawing mode should be marker. And finally, we want our polylines to be red, and our polygons to have a blue outline with a semitransparent yellow fill. The default marker symbol is fine.
Enter the code in Code Listing 26 to create the required DrawingManagerOptions object that will satisfy our requirements.
Code Listing 26: Configuring the DrawingManager
<script> function initMap() { var mapOptions = { center: new google.maps.LatLng(15.5, 10.5), zoom: 3 }; var map; map = new google.maps.Map( document.getElementById('map'), mapOptions); var drawingManager = new google.maps.drawing.DrawingManager({ drawingMode: google.maps.drawing.OverlayType.MARKER, drawingControl: true, drawingControlOptions: { position: google.maps.ControlPosition.TOP_CENTER, drawingModes: ['marker', 'polyline', 'polygon'] }, polylineOptions: { strokeColor: "#FF0000", strokeWeight: 5 }, polygonOptions: { fillColor: "yellow", fillOpacity: 0.5, strokeWeight: 5, strokeColor: "blue" } }); drawingManager.setMap(map); } </script> |
Now our application should appear as shown in Figure 35.

Figure 35: The customized Drawing Manager.
- 1800+ high-performance UI components.
- Includes popular controls such as Grid, Chart, Scheduler, and more.
- 24x5 unlimited support by developers.