
TL;DR: Learn how to build real-time WPF charts for audio visualization using MVVM architecture. This guide shows how to sync audio playback with chart elements for interactive music data analysis.
Welcome to the Chart of the Week blog series!
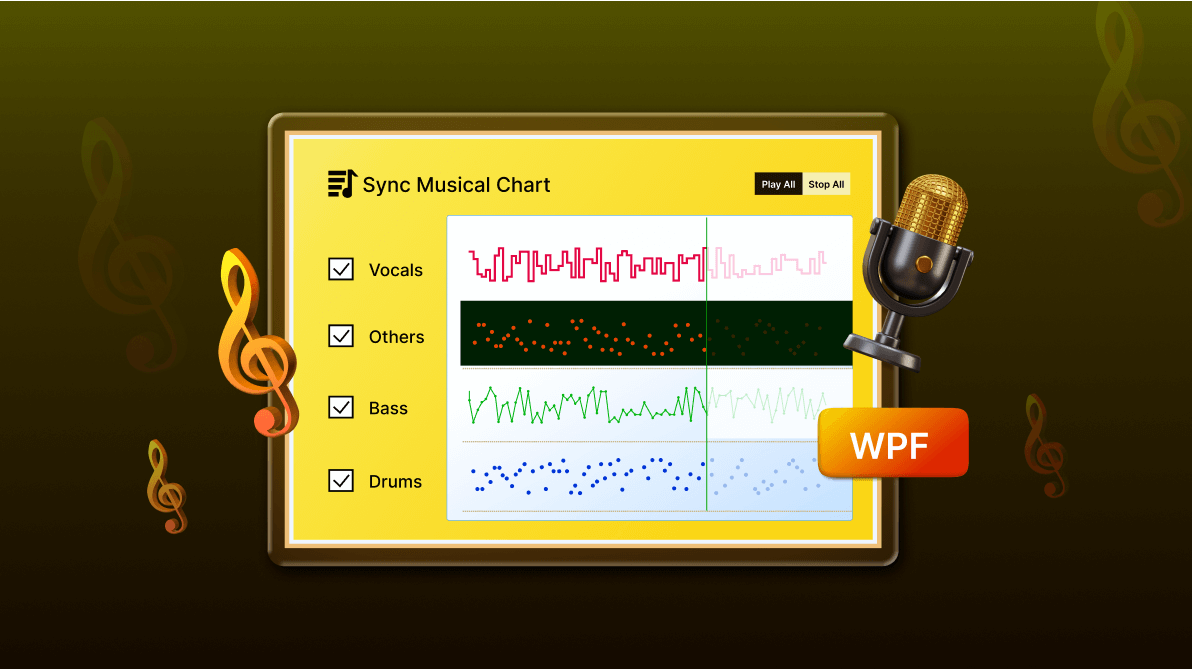
Ever wanted to make your music visible? In this guide, we’ll build a WPF application that transforms audio tracks into dynamic, real-time charts using Syncfusion WPF Charts. You’ll learn how to sync audio playback with visual elements using MVVM architecture and WPF Charts, perfect for developers working on media players, music education tools, or audio analysis apps.
What makes WPF Charts great for audio visualization?
A musical chart is more than just a graph; it visually represents sound. Instead of traditional music notation, we use WPF Charts to display instruments, notes, and audio frequencies as data points. This makes music more accessible and analyzable, even for those without formal training.
Why are musical charts valuable?
Musical charts offer a fresh way to interact with sound:
- Audio track visualization: Multiple tracks play out in real time.
- Pattern recognition: They help identify musical patterns you might miss by ear.
- Educational tool: Musical Charts teach rhythm and harmony visually.
- Performance analysis: It analyzes timing and dynamics across instruments.
Applications in various fields
Musical Charts and audio visualization are increasingly used in:
- Music education: To teach concepts like rhythm, harmony, and instrument characteristics using interactive charts.
- Audio engineering: For visual mixing and mastering references with multiple audio tracks.
- Music production software: It adds charts to Digital Audio Workstations.
- Music therapy: It helps to track responses to musical stimuli.
- Data sonification: It turns complex data into sound and visuals
Why use Syncfusion WPF Charts for audio visualization?
Syncfusion’s WPF Chart components offer powerful features for this kind of application:
- Chart types: You can use line, spline, scatter, and step line series.
- Real-time updates: Dynamic chart refresh during playback.
- Rich customization: You can style each track uniquely.
- Annotations: You can show the playback position with moving indicators.
- Performance: Smooth rendering, even with multiple tracks.
Core functionality
Our audio chart application now focuses on visualizing a single song track with enhanced playback synchronization. Key features include:
- Displays a single song’s waveform or data points as a chart series.
- Plays the corresponding audio file.
- Shows real-time playback position with vertical annotation line.
- Synchronizes audio playback with visual chart progression.
- Gradually darkens chart segments as they’re played.
- Resets colors and playback position when stopped or restarted.
MVVM architecture overview
To build a robust and maintainable WPF application, we use the Model-View-ViewModel (MVVM) design pattern. This approach is ideal for WPF because it leverages its powerful data-binding capabilities. MVVM separates the application’s logic from its user interface, making the code cleaner, easier to test, and more scalable.
- Model: Track class representing data points for each audio track.
- ViewModel: The MusicViewModel class handles state and commands.
- Service: AudioService class handles audio playback.
- View: XAML UI binds to the ViewModel.
The Model: Defining our Musical data
The Model represents the application’s core data structures. Think of it as the blueprint for our data. It holds information but has no knowledge of how that information will be displayed or manipulated.
In our app, the Track class is the Model. It defines a point on our musical chart, containing its coordinates (X, Y) and its color (ColorPath).
public class Track
{
    public double X         { get; set; }
    public double Y         { get; set; }
    public Brush ColorPath  { get; set; }

    public Track(double x, double y, Color color)
    {
        X = x;
        Y = y;
        ColorPath = new SolidColorBrush(color);
    }
}
ViewModel – Managing state and behavior
The ViewModel is the bridge between the Model, which represents our data, and the View, which represents our UI. It contains all the application’s logic and state. When a user interacts with the View, such as clicking the Play button, the View notifies the ViewModel, which determines the appropriate action.
Our MusicViewModel is the central hub. It is responsible for:
- Holding data: It prepares and holds collections of Track data that the chart will display.
- Handling state: It manages the application’s state, such as which instruments are currently enabled or if music is playing.
- Executing actions: It exposes Commands (PlayAllCommand, StopAllCommand) that the UI elements bind to, and contains the logic to execute when those commands are triggered.
- Coordinating services: It tells the AudioService when to play or stop music and synchronizes the audio with the chart’s visual timer.
public class MusicViewModel : INotifyPropertyChanged
{
    // Initializes chart, audio, and timer
    public async Task InitializeAsync(VerticalLineAnnotation playbackLine);

    // Starts playback and updates UI state
    private void StartPlayback();

    // Stops playback and resets UI state
    private void StopPlayback();

    // Plays only the enabled instruments
    private async Task PlayEnabledInstruments();

    // Enables/disables individual instrument tracks
    private void SetInstrumentEnabled(string instrument, bool value);

    // Updates chart visuals for a specific instrument
    private void RefreshInstrumentData(string instrument);

    // Generates randomized chart data for each instrument
    private void GenerateChartData();

    // Loads audio files for each instrument
    private async Task LoadAudioFiles();
}
Audio service: Handling audio playback
In our app, the ViewModel controls the user interface and overall behavior. However, playing audio files involves more detailed work, such as loading files, starting and stopping playback, and adding fade effects. If we put all that into the ViewModel, it would become messy and hard to manage.
To keep things clean, we use a separate class called AudioService. This class handles everything related to audio so the ViewModel doesn’t have to.
What AudioService does
- Loads audio files
- Plays and stops tracks
- Adds smooth fade-in and fade-out effects
- Handles looping and playback completion
The ViewModel just tells the AudioService what to do, like play this track or stop all audio, and the service handles the rest.
Why is this helpful
- Keeps the ViewModel simple and focused
- Makes the audio code easier to reuse and test
- Organizes the project better for future updates
This setup makes the app easier to build, understand, and maintain, especially with real-time audio and charts.
public class AudioService
{
    // Associates the ViewModel with the audio service
    public void SetViewModel(MusicViewModel viewModel);

    // Loads an audio file for a given instrument
    public async Task LoadAudioFile(string instrumentName, string audioFilePath);

    // Starts playback of an audio file with fade-in
    public async Task PlayAudioWithFade(string instrumentName);

    // Stops playback of an audio file with fade-out
    public async Task StopAudioWithFade(string instrumentName);

    // Stops all audio tracks and triggers OnStopPlayback
    public async Task StopAllWithFade();

    // Handles looping when media playback ends
    private void Player_MediaEnded(object? sender, EventArgs e);

    // Enables looping for audio playback
    public void EnableLooping();

    // Disables looping for audio playback
    public void DisableLooping();
}
Configure the WPF Chart
After generating the musical data, the next step is to configure the Syncfusion WPF Chart (SfChart) using this document. You can define the chart’s axes and styles as follows:
<chart:SfChart Grid.Column="1" Grid.Row="1" >
    <chart:SfChart.PrimaryAxis>
        <chart:NumericalAxis Visibility="Hidden"
                             PlotOffsetEnd="20" ShowGridLines="False">
        </chart:NumericalAxis>
    </chart:SfChart.PrimaryAxis>

    <chart:SfChart.SecondaryAxis>
        <chart:NumericalAxis Minimum="0" Maximum="120" Interval="30" Visibility="Hidden" >

            <chart:NumericalAxis.MajorGridLineStyle>
                <Style TargetType="Line">
                    <Setter Property="Stroke" Value="#CC321B0B"/>
                    <Setter Property="StrokeDashArray" Value="2,3"/>
                    <Setter Property="StrokeThickness" Value="1"/>
                </Style>
            </chart:NumericalAxis.MajorGridLineStyle>

            <chart:NumericalAxis.StripLines>
                <chart:ChartStripLine  Start="60" Width="30" Background="#003405" />
            </chart:NumericalAxis.StripLines>

        </chart:NumericalAxis>
    </chart:SfChart.SecondaryAxis>

</chart:SfChart>
Chart series configuration for audio tracks
We need to configure each instrument with a unique chart series type and styling to differentiate audio tracks visually:
<chart:SfChart.Series>

    <!-- Drums -->
    <chart:ScatterSeries
        Visibility="{Binding IsDrumsEnabled, Converter={StaticResource visibilityConverter}}"
        SegmentColorPath="ColorPath"
        ItemsSource="{Binding DrumsData}"
        XBindingPath="X"
        YBindingPath="Y"
        ScatterHeight="6"
        ScatterWidth="6" />

    <!-- Bass -->
    <chart:LineSeries
        Visibility="{Binding IsBassEnabled, Converter={StaticResource visibilityConverter}}"
        SegmentColorPath="ColorPath"
        ItemsSource="{Binding BassData}"
        XBindingPath="X"
        YBindingPath="Y"
        StrokeThickness="2">

        <chart:LineSeries.AdornmentsInfo>
            <chart:ChartAdornmentInfo
                ShowMarker="True"
                Symbol="Diamond"
                SymbolHeight="6"
                SymbolWidth="6" />
        </chart:LineSeries.AdornmentsInfo>

    </chart:LineSeries>

    <!-- Others -->
    <chart:ScatterSeries
        Visibility="{Binding IsOthersEnabled, Converter={StaticResource visibilityConverter}}"
        SegmentColorPath="ColorPath"
        ItemsSource="{Binding OthersData}"
        XBindingPath="X"
        YBindingPath="Y"
        ScatterHeight="6"
        ScatterWidth="6">
    </chart:ScatterSeries>

    <!-- Vocals -->
    <chart:StepLineSeries
        Visibility="{Binding IsVocalsEnabled, Converter={StaticResource visibilityConverter}}"
        SegmentColorPath="ColorPath"
        ItemsSource="{Binding VocalsData}"
        XBindingPath="X"
        YBindingPath="Y"
        StrokeThickness="2" />

</chart:SfChart.Series>
Instrument checkbox implementation
The ability to toggle individual audio tracks is a key feature of our Musical Chart application. Users can toggle instruments via checkboxes.
<Grid Grid.Column="0" Grid.Row="1">
    <Grid.RowDefinitions>
        <RowDefinition Height="*" />
        <RowDefinition Height="*" />
        <RowDefinition Height="*" />
        <RowDefinition Height="*" />
    </Grid.RowDefinitions>

    <Grid.ColumnDefinitions>
        <ColumnDefinition Width="Auto" />
        <ColumnDefinition Width="*" />
    </Grid.ColumnDefinitions>

    <!-- Drums -->
    <CheckBox Grid.Row="3" Grid.Column="0" IsChecked="{Binding IsDrumsEnabled}" Style="{StaticResource MusicCheckboxStyle}" />
    <Label    Grid.Row="3" Grid.Column="1" Content="Drums" Style="{StaticResource instrumentLabelStyle}" />

    <!-- Bass -->
    <CheckBox Grid.Row="2" Grid.Column="0" IsChecked="{Binding IsBassEnabled}" Style="{StaticResource MusicCheckboxStyle}" />
    <Label    Grid.Row="2" Grid.Column="1" Content="Bass" Style="{StaticResource instrumentLabelStyle}" />

    <!-- Others -->
    <CheckBox Grid.Row="1" Grid.Column="0" IsChecked="{Binding IsOthersEnabled}" Style="{StaticResource MusicCheckboxStyle}" />
    <Label    Grid.Row="1" Grid.Column="1" Content="Others" Style="{StaticResource instrumentLabelStyle}" />

    <!-- Vocals -->
    <CheckBox Grid.Row="0" Grid.Column="0" IsChecked="{Binding IsVocalsEnabled}" Style="{StaticResource MusicCheckboxStyle}" />
    <Label    Grid.Row="0" Grid.Column="1" Content="Vocals" Style="{StaticResource instrumentLabelStyle}" />
</Grid>
Each checkbox controls chart visibility and audio playback.
public class MusicViewModel : INotifyPropertyChanged
{
    public bool IsDrumsEnabled
    {
        get => _enabledStatus["Drums"];
        set => SetInstrumentEnabled("Drums", value);
    }

    public bool IsBassEnabled
    {
        get => _enabledStatus["Bass"];
        set => SetInstrumentEnabled("Bass", value);
    }

    public bool IsOthersEnabled
    {
        get => _enabledStatus["Others"];
        set => SetInstrumentEnabled("Others", value);
    }

    public bool IsVocalsEnabled
    {
        get => _enabledStatus["Vocals"];
        set => SetInstrumentEnabled("Vocals", value);
    }
}
This simple UI element provides an intuitive way for users to control which instruments are active in the visualization.
Synchronizing audio with Chart elements
We use a DispatcherTimer to animate playback. As the annotation line moves, it updates chart visuals and recolors segments to show progress.
public class MusicViewModel : INotifyPropertyChanged
{
    // Sets up the DispatcherTimer to animate playback
    private void SetupPlaybackTimer();

    // Moves the vertical annotation line and updates playback position
    private void StartPlayback();

    // Stops the timer and resets the playback state
    private void StopPlayback();

    // Applies visual effects to chart segments as playback progresses
    private void ApplySeriesEffect(double currentX);

    // Resets chart segment colors when playback stops or restarts
    private void ResetTrackColors();
}
Implementing the command pattern
We use the command pattern to handle Play/Stop functionality for audio playback:
public class MusicViewModel : INotifyPropertyChanged
{
    public MusicViewModel()
    {
        PlayAllCommand = new RelayCommand(() => _ = PlayAllAsync());
        StopAllCommand = new RelayCommand(() => _ = StopAllAsync());
    }

    private async Task PlayAllAsync()
    {
        if (!_enabledStatus.Values.Any(v => v))
            return;

        // Reset playback position to start
        _currentX         = 0;
        PlaybackPosition  = 0;
        if (_playbackLine != null)
            _playbackLine.X1 = 0;

        IsPlayButtonEnabled     = false;
        IsStopButtonEnabled     = true;
        IsChartPlaybackActive   = true;

        await _audioService.StopAllWithFade();

        _audioService.OnStartPlayback?.Invoke();
        await PlayEnabledInstruments();

        // Ensure timer is started
        if (_playbackTimer != null && !_playbackTimer.IsEnabled)
        {
            _playbackTimer.Start();
        }

        ResetTrackColors();
    }

    private async Task StopAllAsync()
    {
        IsStopButtonEnabled     = false;
        IsPlayButtonEnabled     = true;
        IsChartPlaybackActive   = false;

        _playbackTimer?.Stop();
        await _audioService.StopAllWithFade();
    }
}
Handling audio track toggling
The application allows enabling/disabling audio tracks through checkboxes, affecting both audio playback and chart visibility:
public class MusicViewModel : INotifyPropertyChanged
{
    private void SetInstrumentEnabled(string instrument, bool value)
    {
        if (_enabledStatus.TryGetValue(instrument, out var currentValue) && currentValue == value)
            return;

        _enabledStatus[instrument] = value;
        OnPropertyChanged($"Is{instrument}Enabled");

        if (IsChartPlaybackActive)
        {
            if (value)
                _ = _audioService.PlayAudioWithFade(instrument);
            else
            {
                _ = _audioService.StopAudioWithFade(instrument);

                if (!_enabledStatus.Values.Any(v => v))
                    _ = StopAllAsync();
            }
        }

        RefreshInstrumentData(instrument);
    }

    private void RefreshInstrumentData(string instrument)
    {
        if (_chartData.TryGetValue(instrument, out var data))
        {
            var tempData = new List(data);
            data.Clear();

            foreach (var point in tempData)
                data.Add(point);
        }
    }
}
Annotation line and color customization
The vertical annotation line moves across the chart, recoloring segments from transparent to opaque as playback progresses.
<chart:SfChart.Annotations>
<chart:VerticalLineAnnotation
x:Name="playbackLine"
X1="{Binding PlaybackPosition}"
Stroke="Green"
StrokeThickness="2.5">
</chart:VerticalLineAnnotation>
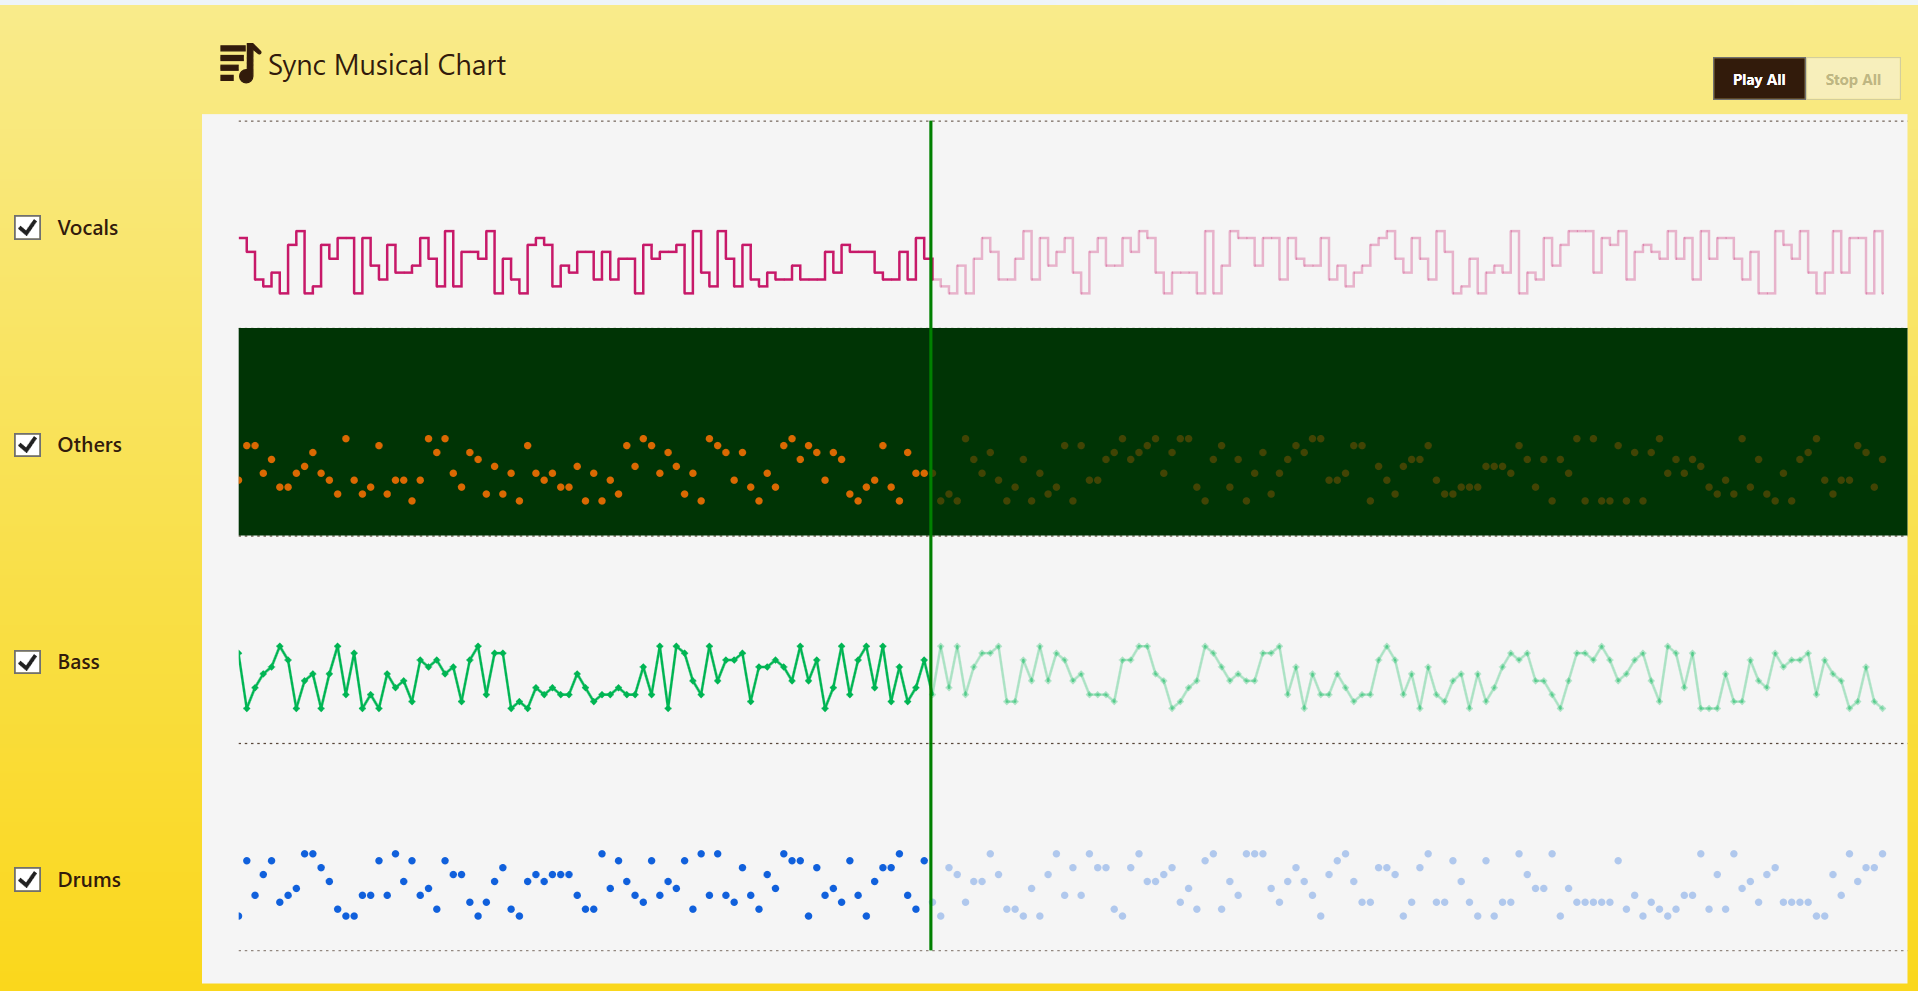
</chart:SfChart.Annotations>After executing the above code examples, the output will appear as shown in the following image.
You can find the video demo in following page
GitHub reference
For more details, refer to the GitHub demo.
FAQs
1. Can I visualize multiple songs or audio files simultaneously?
The current implementation focuses on a single song track. To support multiple songs, you must extend the ViewModel and chart bindings to handle multiple audio sources and series.
2. How can I customize the annotation line style or color dynamically?
While the annotation line is statically styled in XAML, you can bind its properties (like Stroke, StrokeThickness, or X1) to ViewModel properties for dynamic updates.
3. Can tooltips or labels on chart segments be displayed during playback?
Yes, Syncfusion charts supports adornments and tooltips to show the meta data for chart series.
Conclusion
In this blog post, we’ve built a real-time audio visualization app using Syncfusion WPF Charts and MVVM. You learned how to synchronize audio playback with interactive chart elements, enabling dynamic music data analysis.
This application demonstrates the power of Syncfusion WPF Charts to create rich, interactive audio visualizations that combine audio tracks and visual elements. This opens up exciting possibilities for music education, analysis, and creative tools. Try it out and let your charts sing!
For existing Syncfusion customers, the latest version of Essential Studio is available from the license and downloads page. If you are not a customer, try our 30-day free trial to check out these new features.
If you require assistance, please don’t hesitate to contact us via our support forums, support portal, or feedback portal. We are always eager to help you!


 No spam, just valuable updates.