
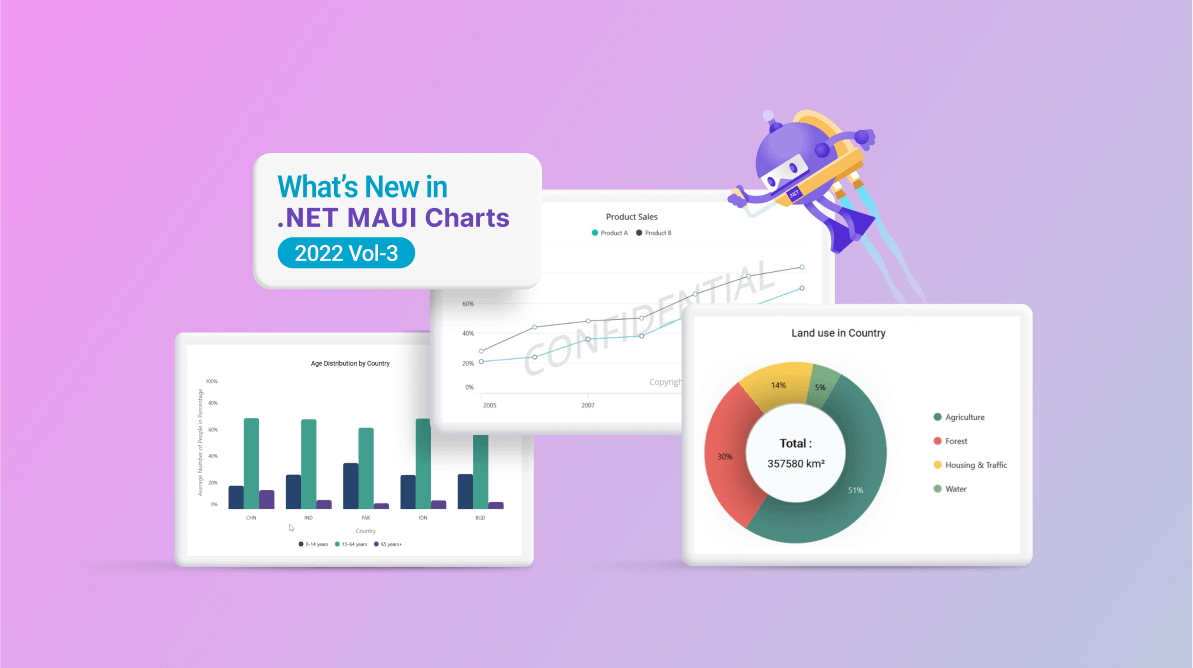
The .NET MAUI Charts control is a well-crafted charting control for visualizing data. It contains a rich gallery of 10+ charts and graphs that cater to all charting scenarios.
In this blog post, I’ll quickly introduce the new features included in the .NET MAUI Charts control for the 2022 Volume 3 release.
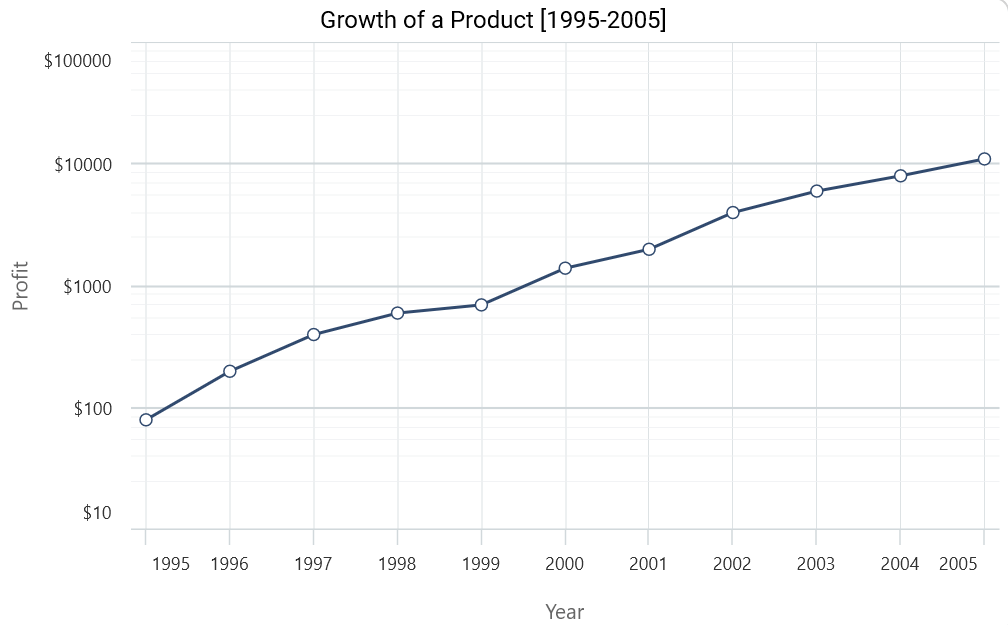
Logarithmic axis
When the largest and smallest values in a data collection are hundreds or even thousands of units apart, the logarithmic scale can be used to describe the data interval.
Our Syncfusion .NET MAUI Charts now support rendering a logarithmic axis. It can compactly display numerical data over a large range of values.
The following code example shows how to configure a logarithmic axis in a .NET MAUI Cartesian Chart.
Xaml
<chart:SfCartesianChart>

 <chart:SfCartesianChart.XAxes>
   <chart:LogarithmicAxis/>
 </chart:SfCartesianChart.XAxes>

 <chart:SfCartesianChart.YAxes>
   <chart:LogarithmicAxis/>
 </chart:SfCartesianChart.YAxes>

</chart:SfCartesianChart>
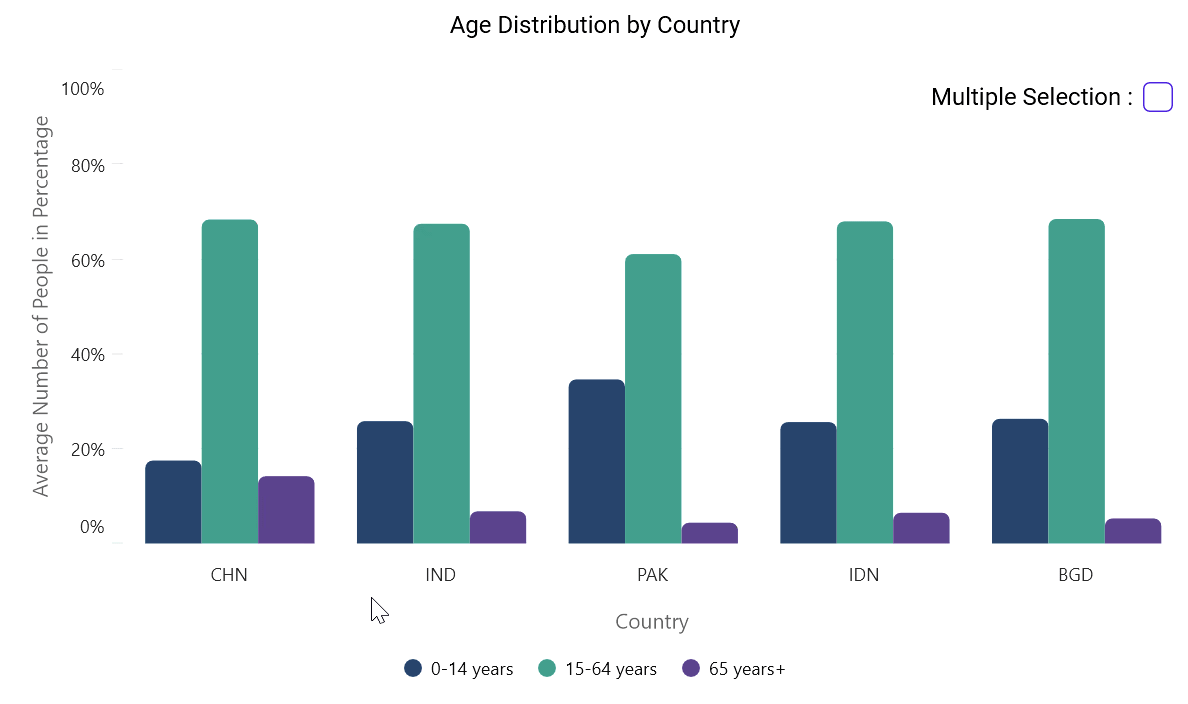
Series selection and multiselection
The .NET MAUI Charts control’s selection behavior highlights a particular element [data point or series] on the chart. In other words, this behavior selects a segment or series.
The following code shows how to configure series selection in a chart.
Xaml
<chart:SfCartesianChart>
 . . .
 <chart:SfCartesianChart.SelectionBehavior>
   <chart:SeriesSelectionBehavior SelectionBrush="Green"/>
 </chart:SfCartesianChart.SelectionBehavior>

 <!--Series collection.-->

</chart:SfCartesianChart>
And the next code shows how to enable the selection of multiple series in .NET MAUI Charts.
Xaml
<chart:SfCartesianChart>
 . . .
 <chart:SfCartesianChart.SelectionBehavior>
  <chart:SeriesSelectionBehavior Type="Multiple"/>
 </chart:SfCartesianChart.SelectionBehavior>

 <!--Series collection.-->

</chart:SfCartesianChart>
Explode segment on touch
Now, you can pop out a particular segment of a circular chart (pie and doughnut) with a touching or tapping interaction. The following code example shows how to configure a segment to explode on touch.
Xaml
<chart:SfCircularChart>
 . . .
 <chart:DoughnutSeries ExplodeOnTouch="True" />
</chart:SfCircularChart>
View in center of doughnut charts
You can place any view in the middle of a doughnut chart. This helps us show more information about the chart data. The following code example shows how to configure the doughnut chart’s center view.
Xaml
<chart:SfCircularChart>
 <chart:SfCircularChart.Series>
  <chart:DoughnutSeries ItemsSource="{Binding DoughnutSeriesData}" XBindingPath="Name" YBindingPath="Value"/>
   <chart:DoughnutSeries.CenterView>
   <Label Text = "{Binding Total, Source={x:Reference doughnutViewModel}}"/>
  </chart:DoughnutSeries.CenterView>
 </chart:SfCircularChart.Series>
</chart:SfCircularChart>
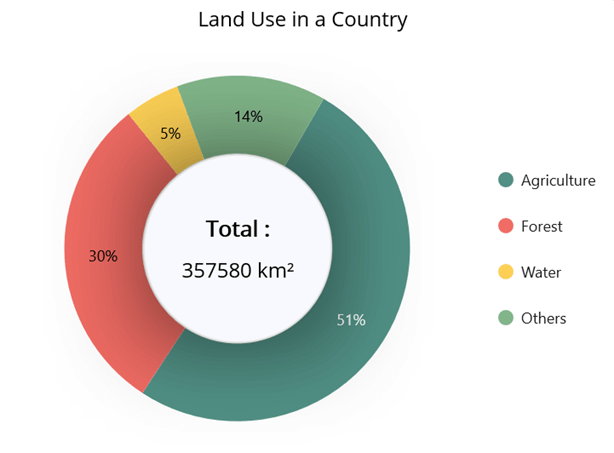
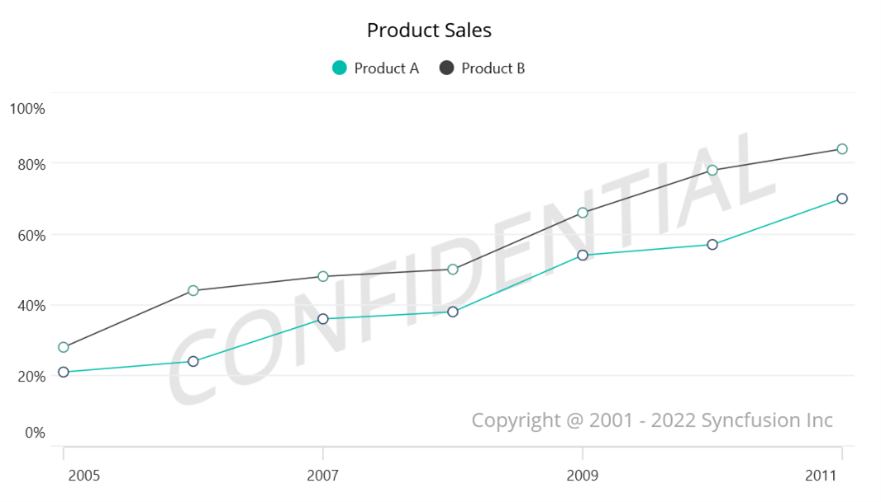
Chart plot area background
Add any view to the chart area. This comes in handy for including relevant information, a watermark, or a color gradient in the chart’s background area.
The following code example shows how to configure the .NET MAUI Cartesian Chart’s plot area background view.
Xaml
<chart:SfCartesianChart>
 <chart:SfCartesianChart.PlotAreaBackgroundView>
  <AbsoluteLayout>
    <Label Text=" Copyright © 2001 - 2022 Syncfusion Inc "
           FontSize="18"
           AbsoluteLayout.LayoutBounds="1,1,-1,-1"
           AbsoluteLayout.LayoutFlags="PositionProportional"
           Opacity="0.4" />
    <Label Text="CONFIDENTIAL"
           Rotation="340"
           AbsoluteLayout.LayoutBounds="0.5,0.5,-1,-1"
           AbsoluteLayout.LayoutFlags="PositionProportional"
           Opacity="0.3" />
  </AbsoluteLayout>
 </chart:SfCartesianChart.PlotAreaBackgroundView>
</chart:SfCartesianChart>
Conclusion
Thanks for reading! We have seen the new features added to the Syncfusion .NET MAUI Charts for the 2022 Volume 3 release. Use these features to make your chart data more readable.
You can get additional details about every new feature in this Volume 3 by reading our release notes and What’s New pages. Have a look at our .NET MAUI Charts GitHub demos and documentation.
Submit your questions or feature requests in the comments section below. You can also reach us through our support forums, support portal, or feedback portal.


 No spam, just valuable updates.