

We at Syncfusion are continuously reviewing the constructive questions and comments we receive from our customers, which includes various feature requests. From these requests, we handpicked the most widely requested features and made them available in the Essential Studio® 2020 Volume 2 release.
In this blog post, I’ll quickly review the new features included in the Flutter Charts widget for the 2020 Volume 2 release.
Let’s see them!
New chart types
We extended the Syncfusion Flutter Charts widget to support two more chart types:
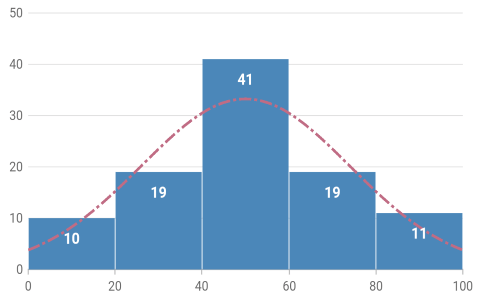
Histogram chart
A histogram chart looks like a bar chart. It is used to represent the distribution of numerical data by rendering vertical bars. Non-discrete values comparison is graphically visualized using the histogram chart.
Refer to the following code example.
[Dart]
SfCartesianChart(
  series: <ChartSeries<_ChartSampleData, double>>[
    HistogramSeries<_ChartSampleData, double>(
      dataSource: <_ChartSampleData>[
        _ChartSampleData(y: 5.250),
        _ChartSampleData(y: 7.750),
        _ChartSampleData(y: 8.275),
        // More data
      ],
      yValueMapper: (_ChartSampleData sales, _) => sales.y
    )
  ]
)
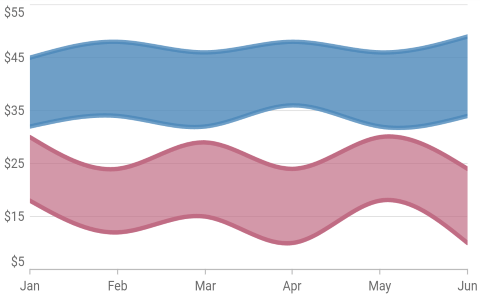
Spline range area chart
A spline range area chart is typically used to display the difference between minimum and maximum values over a period of time, which includes the visualization of set of prices, temperatures, and so on. It connects the data points with a smooth curved line.
Refer to the following code example.
[Dart]
SfCartesianChart(
  series: <ChartSeries<_ChartSampleData, String>>[
    SplineRangeAreaSeries<_ChartSampleData, String>(
      dataSource: chartData,
      xValueMapper: (_ChartSampleData sales, _) => sales.x,
      lowValueMapper: (_ChartSampleData sales, _) => sales.low,
      highValueMapper: (_ChartSampleData sales, _) => sales.high
    ),
    // Add more series.
  ]
)
Axis features
The axis features have the following enhancements in this release.
Animation for axis elements
Axis elements such as labels, ticks, and grid lines can be animated when the axis range is changed dynamically. This is applicable for all the primary and secondary axes in the chart.
Refer to the following code example.
[Dart]
SfCartesianChart(
    enableAxisAnimation: true,
    // Other properties configuration.
)
Axis label alignment
Alignment of the axis labels can be changed to before, after, or to the center of the grid lines in the axis. This is applicable for both the vertical and horizontal axes.
Refer to the following code example.
[Dart]
SfCartesianChart(
  primaryYAxis: NumericAxis(
    // Changes the y-axis labels alignment to end.
    labelAlignment: LabelAlignment.end
  ),
  // Other properties configuration.
)
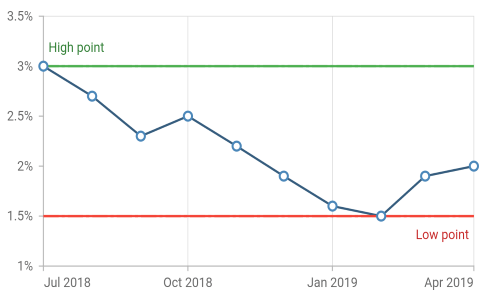
Plot line
The plot bands feature is used to render the plot lines to mark or highlight a specific range in an axis. This is applicable for the vertical and horizontal axes.
Refer to the following code example.
[Dart]
SfCartesianChart(
  primaryYAxis: NumericAxis(
    plotBands: <PlotBand>[
      PlotBand(
        start: 5,
        end: 5,
        borderWidth: 2,
        borderColor: Colors.red
      )
    ]
  ),
  // Other properties configuration.
)
Series features
The series features have the following enhancements in this release.
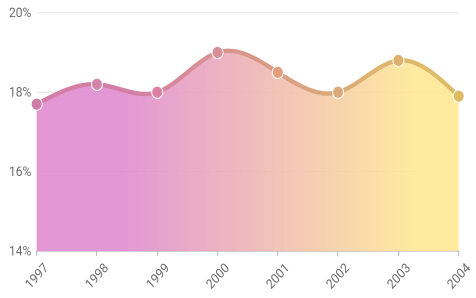
Gradient improvement
The linear gradient of series can be transformed to any desired angle. Also, you can now apply a gradient to the border of series. This can be applied to all the applicable series in the Cartesian chart widget.
Refer to the following code example.
[Dart]
SfCartesianChart(
  series: <ChartSeries<_ChartSampleData, String>>[
    SplineAreaSeries<_ChartSampleData, String>(
      gradient: LinearGradient(
        colors: const <Color>[
          Color.fromRGBO(269, 210, 255, 1),
          Color.fromRGBO(143, 236, 154, 1)
        ],
        stops: const <double>[
          0.2,
          0.6
        ],
        begin: Alignment.bottomCenter,
        end: Alignment.topCenter
      ),
    ),
    // Add more series.
  ]
)
Hide data labels for 0 value
A data label and its connector line can be hidden for the data points with a value of zero. This is applicable to all the chart types in the Cartesian chart, circular chart, funnel chart, and pyramid chart widgets.
Refer to the following code example.
[Dart]
SfCircularChart(
  Series: <PieSeries<_ChartSampleData, String>>[
    PieSeries<_ChartSampleData, String>(
      dataLabelSettings: DataLabelSettings(
        isVisible: true,
        // Hide the data labels for zero value
        showZeroValue: true
      )
    )
  ]
)
Indication for identical values in financial series
If the high and low values of a data point are the same, an indication (small vertical line) can be rendered to indicate that. This is applicable for financial charts like HiLo, OHLC, and candle.
Refer to the following code example.
[Dart]
SfCartesianChart(
  Series: <ChartSeries<_ChartSampleData, DateTime>>[
    HiloSeries<_ChartSampleData, DateTime>(
      dataSource: [
        _ChartSampleData(DateTime(2016, 01, 11), 95.36, 101.19),
        _ChartSampleData(DateTime(2016, 01, 18), 93.42, 101.46),
        // High and low values are the same here.
        _ChartSampleData(DateTime(2016, 02, 22), 94.0237, 94.0237),
      ]
      xValueMapper: (_ChartSampleData sales, _) => sales.x,
      lowValueMapper: (_ChartSampleData sales, _) => sales.low,
      highValueMapper: (_ChartSampleData sales,_) => sales.high,
      showIndicationForSameValues: true
    )
  ]
)
Performance improvement
Chart loading time improvement
We have modified the rendering logics internally to improve the loading performance of all the series types in Charts. Now charts will be rendered in half of the previous time.
Live update improvement
Before in live updates, all the data points in a chart would be processed again and again. But now, we have provided a public method to get the newly added, updated, and removed data points in a series from the user. We will process those points only and skip the processing of existing data points in charts. This will improve the app’s performance and use less memory while updating the charts continuously. This method is the recommended approach for live update scenarios.
Refer to the following code example.
[Dart]
ChartSeriesController _chartSeriesController;

SfCartesianChart(
  series: <LineSeries<SalesData, num>>[
    LineSeries<SalesData, num>(
      dataSource: chartData,
      onRendererCreated: (ChartSeriesController controller) {
        _chartSeriesController = controller;
      }
    )
  ]
)

RaisedButton(
  onPressed: () {
    chartData.removeAt(0);
    chartData.add(ChartData(3,23));
    //Passed the added and removed data point indexes.
    _chartSeriesController.updateDataSource(
      addedDataIndex: chartData.length -1,
      removedDataIndex: 0
    );
  }
)
Breaking changes
Appearance of axis label rotation changed
Taking readability into consideration, the axis label rotation of the rotate45 and rotate90 values in the labelIntersectAction property have been changed from 45 and 90 degrees to -45 and -90 degrees, respectively.
Customize chart text elements using TextStyle class
The TextStyle class has more built-in customizing options. So, the text elements in a chart (chart titles, axis titles, axis labels, data label text, legend item text, tooltip text, plot band text) can be customized using the properties in the TextStyle class, instead of the ChartTextStyle class. The ChartTextStyle class is now deprecated.
Refer to the following code example.
[Dart]
SfCartesianChart(
  primaryXAxis: NumericAxis(
    labelStyle: TextStyle(
      color: Colors.red,
      fontSize: 14.0
    )
  )
)
Overriding the chart series implementation
The override methods have now been moved from the series class to the renderer class. So, to modify the series types rendering with your own custom implementation, you must override the renderer class of the specific series, instead of overriding the series class along with the segment class.
Refer to the following code example.
[Dart]
SfCartesianChart(
  series: <ChartSeries<SalesData, num>>[
    LineSeries<SalesData, num>(
      onCreateRenderer:(ChartSeries<dynamic, dynamic> series){
        return CustomLineSeriesRenderer();
      }
    )
  ]
)

class CustomLineSeriesRenderer extends LineSeriesRenderer {
  /// Custom implementation here.
}
Conclusion
I hope you now have a clear idea of the various new features and enhancements available for the Syncfusion Flutter Charts widget in the 2020 Volume 2 release. For more details about the bug fixes and other enhancements, check out our release notes.
Browse our documentation to learn more about our Flutter widgets. You can also see Syncfusion’s Flutter app with many examples in this GitHub repo. Don’t miss our demo app in Google Play and the App Store.
If you aren’t a customer yet, you can try our 30-day free trial to check out these features.
Also, if you wish to send us feedback or would like to submit any questions, please feel free to post them in the comments section of this blog post. You can also contact us through our support forum, feedback portal, or Direct-Trac support system. We are always happy to assist you!


 No spam, just valuable updates.