

We are excited to share that we have enhanced the chart in Essential JS 2 with the following new features in our 2018 Volume 2 release:
- Scrollbar for zooming and panning.
- Histogram series.
- Grouping slice in accumulation charts.
Scrollbar for zooming and panning
Panning and zooming the chart can be done using mouse and touch actions on a chart area. However, if we have a scrollbar on an axis, it is easier to zoom or view data on a desktop. So, in this release, we have provided support for scrollbars in chart and they work as shown in the following.
let chart: Chart = new Chart({
                 zoomSettings:
                   {
                       enableScrollbar: true
                   }
 });
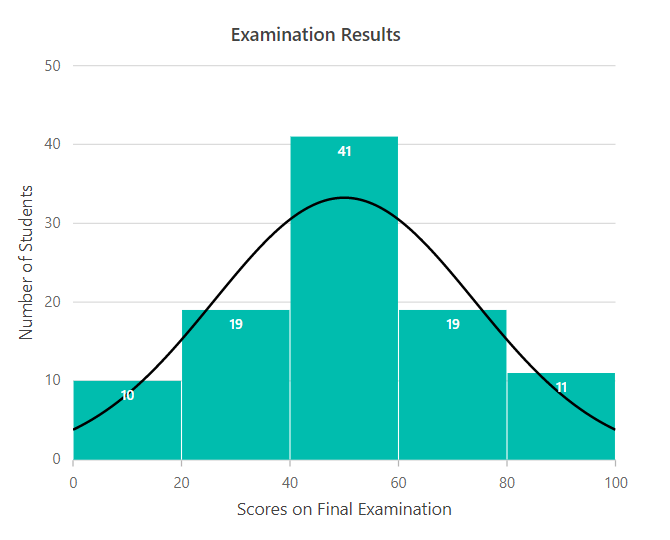
Histogram series
We have added a new series type called histogram for this release. The histogram series provides options to visualize large amounts of data that are difficult to present in a tabular or spreadsheet form.
let chart: Chart = new Chart({
              series: [
                       { type: 'Histogram' }
                     ]
 });
Grouping slice in accumulation charts
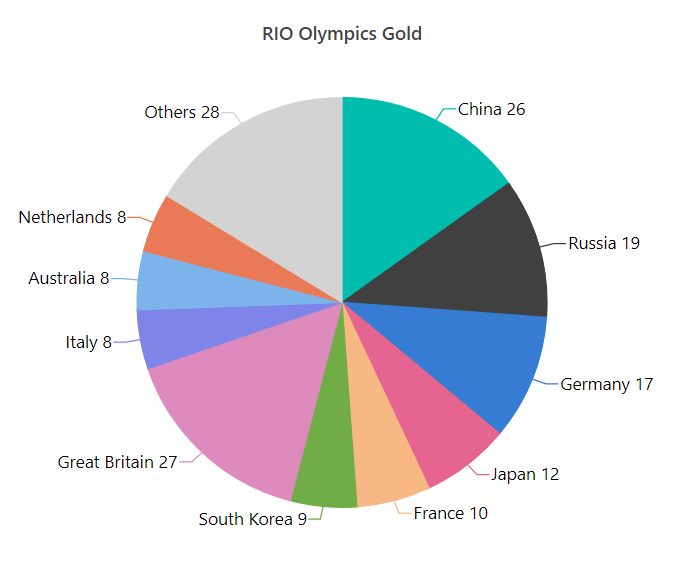
let pie: AccumulationChart = new AccumulationChart({
                groupTo: '9',
                groupMode: 'Point'
});
If you like this blog post, we think you’ll also like the following free e-books:
- JavaScript Succinctly
- TypeScript Succinctly
- AngularJS Succinctly
- Angular 2 Succinctly
- React.js Succinctly
 No spam, just valuable updates.