

TL;DR: Developers often struggle with exporting Pivot Tables from React apps to Excel without losing interactivity. This guide focuses on exporting Pivot Tables to native Excel format in React, using a server-side ASP.NET Core backend to preserve filters, drill-downs, and aggregations in fully interactive native Excel Pivot Tables.
Traditional Excel exports flatten pivot data, losing interactivity like filtering, grouping, and drill-down. This limits offline analysis capabilities for business users.
Modern dashboards demand more than just data, they need dynamic, interactive analytics that scale. If you’re building enterprise-grade apps in React, Syncfusion’s React Pivot Table is a go-to for slicing and dicing large datasets with speed and flexibility.
But what happens when users want to analyze data offline in Excel, without losing the pivot structure, filters, or drill-down capabilities?
That’s where Syncfusion’s server-side Pivot Engine with Export as Pivot comes in. This guide shows you how to export a fully interactive Pivot Table from React to native Excel format, preserving everything from aggregations to field configurations.
Why export to native Excel Pivot format?
Traditional Excel exports flatten pivot data into static tables, losing interactivity. Syncfusion’s server-side Pivot Engine() method changes that by generating a true Excel Pivot Table with:
- Dynamic row/column grouping
- Interactive filtering and sorting
- Drill-down/up capabilities
- Real-time aggregation (e.g., sum, average, count, etc.)
- Field list reconfiguration in Excel
This empowers users to continue analyzing data offline, just like in the web app. And when combined with Syncfusion’s server-side pivot engine, you get optimal performance even with datasets exceeding 10,000+ records.
Real-world use case: Sales analytics dashboard
Imagine a global retail company uses a React-based sales analytics dashboard to analyze over 10,000 product sales records across years, countries, and categories.
Business need:
Sales managers want to download performance data for offline review while retaining the ability to filter, drill into trends, and re-aggregate.
Solution:
Use Syncfusion PivotView with server-side processing via Syncfusion.Pivot.Engine and native Excel pivot export via exportAsPivot() to deliver a seamless, interactive offline experience.
Architecture overview
Syncfusion leverages a hybrid architecture:
- Frontend (React): Renders the PivotView and sends user interactions.
- Backend (ASP.NET Core): Processes data using
Syncfusion.Pivot.Engineand handles export logic via PivotExportEngine<T>. Only aggregated results are sent to the client, boosting performance and security.
Step-by-step implementation
Let’s build a working example that exports a sales dataset to a native Excel Pivot Table based on the current implementation.
Prerequisites
Before proceeding, ensure the following are properly set up.
- Syncfusion React Pivot Table component
- ASP.NET Core Web API
- NuGet packages: Syncfusion.EJ2.AspNet.Core and Syncfusion.Pivot.Engine
- TypeScript support
Step 1: Set up the React frontend with Pivot Table support
First, install the required pivot table packages:
npm install @syncfusion/ej2-react-pivotview@^30.2.4

npm install react@^19.1.1 react-dom@^19.1.1

npm install --save-dev typescript@~5.8.3 @types/react@^19.1.9
Then configure PivotViewComponent with server mode and export button using exportAsPivot() method.
App.tsx
import { useRef, useState, useEffect } from 'react';
import { ButtonComponent } from '@syncfusion/ej2-react-buttons';
import {
PivotViewComponent,
Inject,
FieldList,
CalculatedField,
Toolbar,
PDFExport,
ExcelExport,
ConditionalFormatting,
NumberFormatting,
GroupingBar,
VirtualScroll,
DrillThrough
} from '@syncfusion/ej2-react-pivotview';
function App() {
const [isLoading, setIsLoading] = useState(true);
const [exportStatus, setExportStatus] = useState('');
const dataSourceSettings = {
url: 'http://localhost:5276/api/pivot/post', // ASP.NET Core API endpoint
mode: 'Server' as any, // Server mode for remote data processing
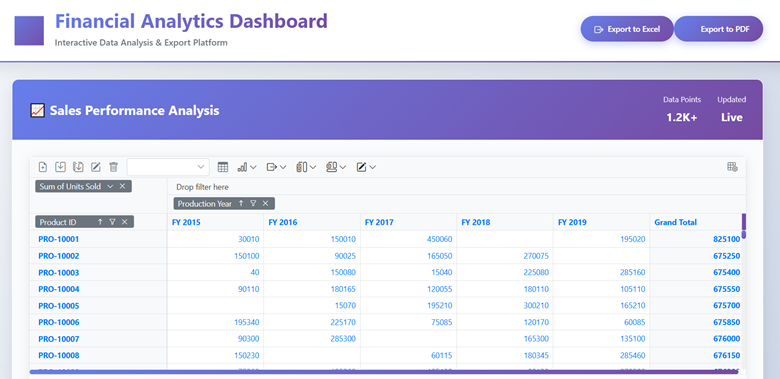
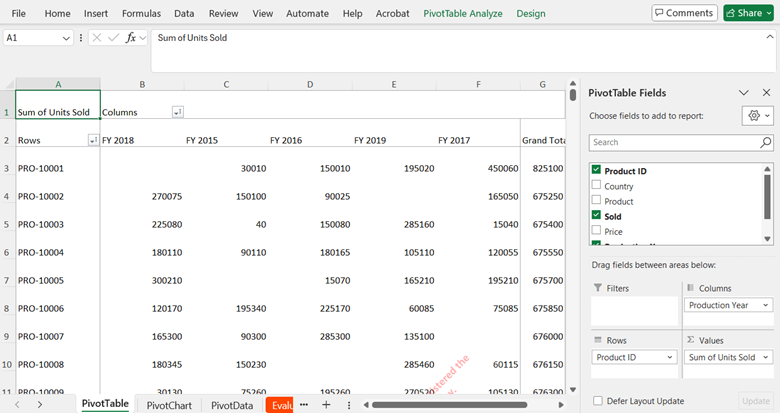
rows: [{ name: 'ProductID', caption: 'Product ID' }],
formatSettings: [{ name: 'Price', format: 'C' }],
columns: [{ name: 'Year', caption: 'Production Year' }],
values: [{ name: 'Sold', caption: 'Units Sold' }],
};
const pivotObj = useRef<PivotViewComponent>(null);
// Export as native Excel PivotTable using exportAsPivot
const btnClick = (): void => {
if (pivotObj.current) {
setExportStatus('Exporting...');
try {
// KEY: This calls the exportAsPivot method, which preserves pivot structure
(pivotObj.current as any).exportAsPivot();
setTimeout(() => {
setExportStatus('Export completed!');
setTimeout(() => setExportStatus(''), 3000);
}, 500);
} catch (error) {
setExportStatus('Export failed');
setTimeout(() => setExportStatus(''), 3000);
}
}
};
return (
<div className="dashboard-container">
<header className="dashboard-header">
<div className="header-content">
<h1 className="dashboard-title">Financial Analytics Dashboard</h1>
<div className="export-buttons">
<ButtonComponent
cssClass='e-primary export-btn'
onClick={btnClick}
iconCss="e-icons e-export"
>
Export to Excel
</ButtonComponent>
</div>
</div>
</header>
<main className="dashboard-main">
<PivotViewComponent
ref={pivotObj}
id='PivotView'
height={500}
dataSourceSettings={dataSourceSettings}
showToolbar={true}
allowExcelExport={true}
showGroupingBar={true}
showFieldList={true}
allowCalculatedField={true}
enableVirtualization={true}
>
<Inject
services={[
FieldList,
CalculatedField,
Toolbar,
ExcelExport,
ConditionalFormatting,
NumberFormatting,
GroupingBar,
VirtualScroll,
DrillThrough
]}
/>
</PivotViewComponent>
</main>
</div>
);
}
export default App;Step 2: Backend: ASP.NET Core controller setup
Install the required NuGet packages:
<PackageReference Include="Microsoft.AspNetCore.Mvc.NewtonsoftJson" Version="9.0.8" />
<PackageReference Include="Syncfusion.EJ2.AspNet.Core" Version="30.1.42" />
<PackageReference Include="Syncfusion.Pivot.Engine" Version="30.1.42" />
Then, set up PivotController.cs to handle pivot data and export logic. The onPivotExcelExport action triggers ExportAsPivot() to generate the Excel file with full interactivity.
PivotController.cs
using System;
using System.Collections.Generic;
using System.Threading.Tasks;
using Microsoft.AspNetCore.Mvc;
using Microsoft.Extensions.Caching.Memory;
using Newtonsoft.Json;
using Syncfusion.Pivot.Engine;

namespace PivotExportAPI.Controllers
{
    [Route("api/[controller]")]
    public class PivotController : Controller
    {
        private readonly IMemoryCache _cache;
        private readonly ILogger<PivotController> _logger;
        private bool isRendered;
        private PivotEngine<SalesDataModel> PivotEngine = new PivotEngine<SalesDataModel>();
        private ExcelExport excelExport = new ExcelExport();
        private PivotExportEngine<SalesDataModel> pivotExport = new PivotExportEngine<SalesDataModel>();

        public PivotController(IMemoryCache cache, ILogger<PivotController> logger)
        {
            _cache = cache;
            _logger = logger;
        }

        [Route("/api/pivot/post")]
        [HttpPost]
        public async Task<object> Post([FromBody] object args)
        {
            try
            {
                _logger.LogInformation("📊 Pivot API request received");
                FetchData param = JsonConvert.DeserializeObject<FetchData>(args.ToString());
                _logger.LogInformation("🔧 Processing action: {Action}", param?.Action);

                if (param.Action == "fetchFieldMembers")
                {
                    return await GetMembers(param);
                }
                else if (param.Action == "fetchRawData")
                {
                    return await GetRawData(param);
                }
                else if (param.Action == "onExcelExport" || param.Action == "onCsvExport" ||
                         param.Action == "onPivotExcelExport" || param.Action == "onPivotCsvExport")
                {
                    EngineProperties engine = await GetEngine(param);

                    if (param.Action == "onPivotExcelExport" || param.Action == "onPivotCsvExport")
                    {
                        _logger.LogInformation("📊 Executing native pivot export");
                        // ⭐ KEY: This is the exportAsPivot functionality that preserves pivot structure
                        return pivotExport.ExportAsPivot(
                            param.Action == "onPivotExcelExport" ? ExportType.Excel : ExportType.CSV,
                            engine,
                            param
                        );
                    }
                    // ... other export types
                }
                else
                {
                    return await GetPivotValues(param);
                }
            }
            catch (Exception ex)
            {
                _logger.LogError(ex, "❌ Error processing pivot request: {Error}", ex.Message);
                return new { error = ex.Message };
            }
        }

        private async Task<object> GetData(FetchData param)
        {
            return await _cache.GetOrCreateAsync("dataSource" + param.Hash, async (cacheEntry) =>
            {
                cacheEntry.SetSize(1);
                cacheEntry.AbsoluteExpiration = DateTimeOffset.UtcNow.AddMinutes(60);
                // Generate 10,000 virtual sales records for demonstration
                return new SalesDataModel().GetVirtualData();
            });
        }

        // Additional helper methods: GetEngine, GetMembers, GetRawData, GetPivotValues
        // (See full implementation in PivotExportAPI/Controllers/PivotController.cs)
    }

    public class SalesDataModel
    {
        public string ProductID { get; set; } = string.Empty;
        public string Country { get; set; } = string.Empty;
        public string Product { get; set; } = string.Empty;
        public double Sold { get; set; }
        public double Price { get; set; }
        public string Year { get; set; } = string.Empty;

        public List<SalesDataModel> GetVirtualData()
        {
            List<SalesDataModel> VirtualData = new List<SalesDataModel>();
            var random = new Random();

            // Generate 10,000 records for server-side processing
            for (int i = 1; i <= 10000; i++)
            {
                SalesDataModel p = new SalesDataModel
                {
                    ProductID = "PRO-" + (10001 + (i % 1000)),
                    Year = (new string[] { "FY 2015", "FY 2016", "FY 2017", "FY 2018", "FY 2019" })[random.Next(5)],
                    Country = (new string[] { "Canada", "France", "Australia", "Germany", "France" })[random.Next(5)],
                    Product = (new string[] { "Car", "Van", "Bike", "Flight", "Bus" })[random.Next(5)],
                    Price = (3.4 * i) + 500,
                    Sold = (i * 15) + 10
                };
                VirtualData.Add(p);
            }

            return VirtualData;
        }
    }
}
Step 3: Configure Program.cs for server-side services
Here’s the server configuration to enable CORS, memory caching, and necessary services for optimal performance and secure communication between frontend and backend.
var builder = WebApplication.CreateBuilder(args);

// Add services to the container
builder.Services.AddControllers()
    .AddNewtonsoftJson(options =>
    {
        options.SerializerSettings.DateTimeZoneHandling = Newtonsoft.Json.DateTimeZoneHandling.Utc;
        options.SerializerSettings.DateFormatHandling = Newtonsoft.Json.DateFormatHandling.IsoDateFormat;
    });

// Configure CORS for React frontend (Vite dev server runs on port 5173)
builder.Services.AddCors(options =>
{
    options.AddPolicy("ReactApp", builder =>
    {
        builder.WithOrigins("http://localhost:5173", "https://localhost:5173")
               .AllowAnyMethod()
               .AllowAnyHeader()
               .WithExposedHeaders("Content-Disposition"); // Important for file downloads
    });
});

builder.Services.AddOpenApi();
builder.Services.AddMemoryCache(); // For performance optimization

var app = builder.Build();

if (app.Environment.IsDevelopment())
{
    app.MapOpenApi();
}

app.UseHttpsRedirection();
app.UseCors("ReactApp"); // Enable CORS
app.UseAuthorization();
app.MapControllers();

Console.WriteLine("🚀 Syncfusion Pivot Export API is running!");
Console.WriteLine("📊 Endpoints available at http://localhost:5276/api/pivot/post");

app.Run();
The PivotExportEngine<T> with ExportAsPivot() method generates a .xlsx file with:
- Raw data source preserved in Excel
- A native Excel Pivot Table on the primary sheet
- All row/column/value field configurations intact
- Interactive filtering, sorting, and drill-down capabilities
Key advantages over standard Excel export
| Feature | Standard Export | Syncfusion Export as Pivot |
| Pivot Structure | Flattened Table | Full Pivot Table |
| Filtering | Static | Interactive in Excel |
| Aggregation | Pre-calculated | Dynamic Recalculation |
| Grouping | Lost | Preserved (Years, Quarters, etc.) |
| Performance (Large Data) | Client-heavy | Server-optimized |
| Offline Analytics | Limited | Full Self-Service |
Best practices for production use
- Use memory caching: Reduce database hits with IMemoryCache or Redis.
- Secure API endpoints: Apply JWT and CORS policies.
- Optimize large exports: Use virtual scrolling, pagination, or background jobs.
- Enable GZIP compression: Reduce payload size and latency.
Try it yourself
Ready to see it in action? The complete implementation is available on GitHub. The project includes a React frontend and ASP.NET Core backend.
To run the backend API, start the ASP.NET Core server by running the commands below,
cd PivotExportAPI
dotnet run
To run the React frontend, run the commands below,
cd react-pivot-excel-export
npm install
npm run dev
You can visit localhost:5173, interact with the Pivot Table, and click Export to Excel to download a native Excel Pivot Table.
Conclusion
Thank you for reading this blog post. We’ve explored how to export Syncfusion React Pivot Table to native Excel Pivot format in a React application, a powerful step forward for enterprise analytics. Combining server-side processing with full interactivity can unlock high performance for large datasets, ensure a secure and scalable architecture, and empower users with offline self-service BI.
If you’re already a Syncfusion user, download the setup from the license and downloads page. New to Syncfusion? Start your journey with a 30-day trial and experience the difference.
Have questions or need assistance? Connect with us through our support forum, support portal, or feedback portal. We’re here to help you succeed.


 No spam, just valuable updates.