
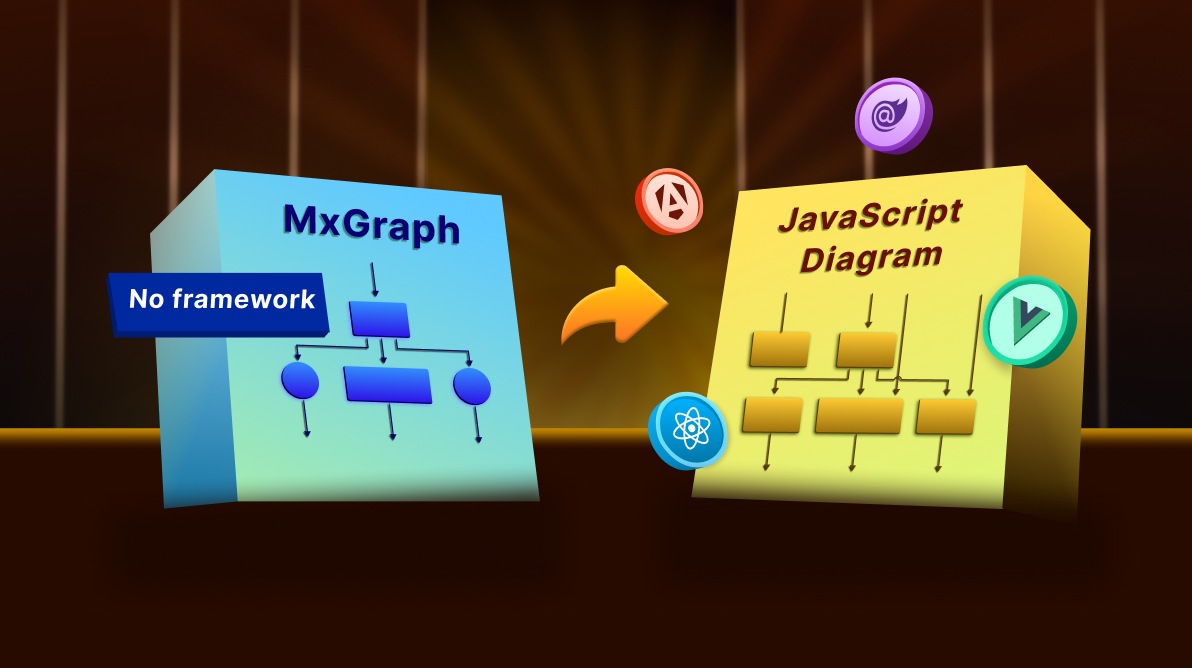
TL;DR: Still using mxGraph for diagramming? It’s time to move on. With no active development and limited modern features, mxGraph is holding your app back. Syncfusion JavaScript Diagram is a powerful, future-ready alternative, offering rich built-in tools, seamless framework integration, and active support for building scalable, interactive diagramming solutions.
Are you a developer relying on mxGraph for your diagramming tools, only to find its limitations hindering your progress? With mxGraph no longer actively developed, it’s time to explore a powerful, modern mxGraph alternative to future-proof your applications.
This article introduces Syncfusion® JavaScript Diagram, a robust and feature-rich library designed to streamline your diagramming development and overcome the challenges of outdated tools.
We’ll explain why Syncfusion is the superior choice, how it boosts productivity, and how you can seamlessly transition.
Why migrate away from mxGraph?
mxGraph once served as a lightweight, low-level JavaScript Diagramming library, but today its limitations are clear:
- No active development on the open-source version.
- Outdated architecture and minimal built-in UI features.
- Limited built-in shapes and layout algorithms.
- Manual work is required for common features like data binding, port management, and diagram serialization.
- Lack of modern UI framework integration (e.g., Angular, React, Vue out-of-the-box support).
These limitations make it difficult to scale or maintain diagramming applications built on mxGraph.
Introducing Syncfusion JavaScript Diagram: The top mxGraph alternative
Syncfusion JavaScript Diagram component is a robust, high‑level library designed for building interactive, scalable diagramming applications. Whether you’re creating flowcharts, organizational charts, mind maps, or BPMN diagrams, it delivers a complete set of built‑in tools and features, ready to use out of the box.
Advantages of Syncfusion over mxGraph
| Feature | mxGraph | Syncfusion JS Diagram |
| Active maintenance | No | Yes |
| Built-in layouts | Manual implementation | Tree, Radial, Mind Map, Hierarchical |
| Port & connector support | Basic | Advanced, customizable |
| Undo/redo functionality | Requires custom logic | Built-in |
| Symbol palette | Not available | Built-in |
| Serialization | JSON/XML | Full JSON support |
| Framework support | Limited | Angular, React, Vue, Blazor |
| UI interactions | Basic | Rich interaction support |
| Shape customization | Limited | Full templating support |
| Documentation & support | Minimal | Extensive + live demos |
| Print/Export | Manual implementation | Built-in |
| Accessibility | No native support | Keyboard and ARIA support |
| Localization | Not supported | Built-in |
Features that make migration worthwhile
1. Built-in node and connector support
Create flowcharts, organizational charts, mind maps, UML diagrams, BPMN, and more with built-in shape libraries and customizable connectors.
2. Automatic layout algorithms
Built-in layout engines like hierarchical, radial, tree, flowchart, and mind map layouts make arranging nodes effortless; no custom logic required.
3. High-Level API
Unlike mxGraph’s low-level drawing API, Syncfusion provides high-level abstractions for creating, manipulating, and interacting with diagram elements.
4. Seamless integration with frameworks
Whether you’re building with React, Angular, Vue, or Blazor, the diagram component integrates cleanly with idiomatic support for your stack.
5. Advanced editing and interaction
Out-of-the-box features like snapping, undo-redo, port-based connection, symbol palette, context menu, zooming, and panning reduce the need for manual implementation.
6. Serialization and persistence
We can easily save and load diagrams in JSON format, including nodes, connectors, custom data, and layout settings.
7. Extensive customization
We can also customize node shapes, styles, interactions, and behaviors via templates and event hooks.
8. Ongoing support and updates
Syncfusion JavaScript Digram Library offers regular updates, a responsive support team, and comprehensive documentation and demos.
How to migrate from mxGraph to Syncfusion JavaScript Diagram Library?
Transitioning from mxGraph to Syncfusion JS Diagram doesn’t have to be overwhelming. Here’s a simplified approach:
- Define your diagram model: Identify the shapes, connectors, and interactions you need.
- Use the node and connector objects: Map your mxGraph nodes to Syncfusion® JS Diagram Library’s node and connector structure.
- Apply layout engines: Use built-in layouts where applicable.
- Add ports and constraints: Easily define input/output points using port definitions.
- Enable editing features: Add tools like symbol palette, snapping, undo-redo, and zoom with simple config options.
- Customize as needed: Use templates and event handlers for deep customizations.
You’ll spend less time wiring up low-level behaviors and more time delivering value to users.
Note: You can refer to an in-depth migration guide from mxGraph to JavaScript Diagram in our documentation.
FAQs
Q1: How seamless is the migration process from mxGraph to Syncfusion JavaScript Diagram?
Migration is straightforward. Syncfusion provides high-level APIs, layout engines, and port-based connections that map well to mxGraph structures. To simplify the transition, Syncfusion documentation includes a detailed migration guide.
Q2: What types of diagrams can I create with Syncfusion?
Syncfusion supports all major diagram types, including flowcharts, organizational charts, mind maps, UML diagrams, BPMN workflows, network diagrams, and custom visual editors.
Q3: Does Syncfusion JavaScript Diagram support React, Angular, and Vue?
Yes, Syncfusion provides native integration with React, Angular, Vue, and Blazor, including framework-specific components, TypeScript definitions, and integration patterns.
Q4: How customizable is the look and behavior of diagrams in Syncfusion?
Syncfusion offers deep customization through templating, custom shapes, styling, and event hooks. Developers can control every aspect, from node appearance and connector styles to interaction behaviors like drag, resize, and tooltips, using simple configuration or custom code.

Conclusion
Thanks for reading! While mxGraph served its purpose, modern web applications demand more robust, actively maintained solutions than it can offer. The Syncfusion JavaScript Diagram control not only matches but significantly exceeds mxGraph‘s capabilities, providing unparalleled ease of use, broad framework compatibility, and comprehensive features. As the definitive mxGraph alternative, Syncfusion offers a future-proof diagramming solution for building visual editors, process designers, or workflow tools, enabling you to develop faster, reduce maintenance, and deliver superior user experiences.
Take the next step: Explore Syncfusion JavaScript Diagram today! You can examine our online examples and documentation for more features and functionalities.
Existing Syncfusion users can download the newest version of Essential Studio from the license and downloads page, while new users can start a 30-day free trial to experience its full potential.
Our dedicated support team is also available via the support forum, support portal, or feedback portal for any questions or concerns, committed to providing prompt and comprehensive assistance.


 No spam, just valuable updates.