
TL;DR: Gantt charts are timeline-based tools that visually map tasks, durations, and progress, making them ideal for projects with clear schedules and dependencies. PERT charts, on the other hand, use a network-based approach to model task relationships and calculate the critical path, helping teams manage uncertainty and optimize resource allocation. Choose Gantt for predictable workflows and visual clarity; opt for PERT when dealing with complex, interdependent tasks or risk-sensitive projects.
In 2025, managing remote teams, following agile practices, and meeting tight deadlines is more challenging than ever. Choosing the right project management tool can significantly impact your workflow.
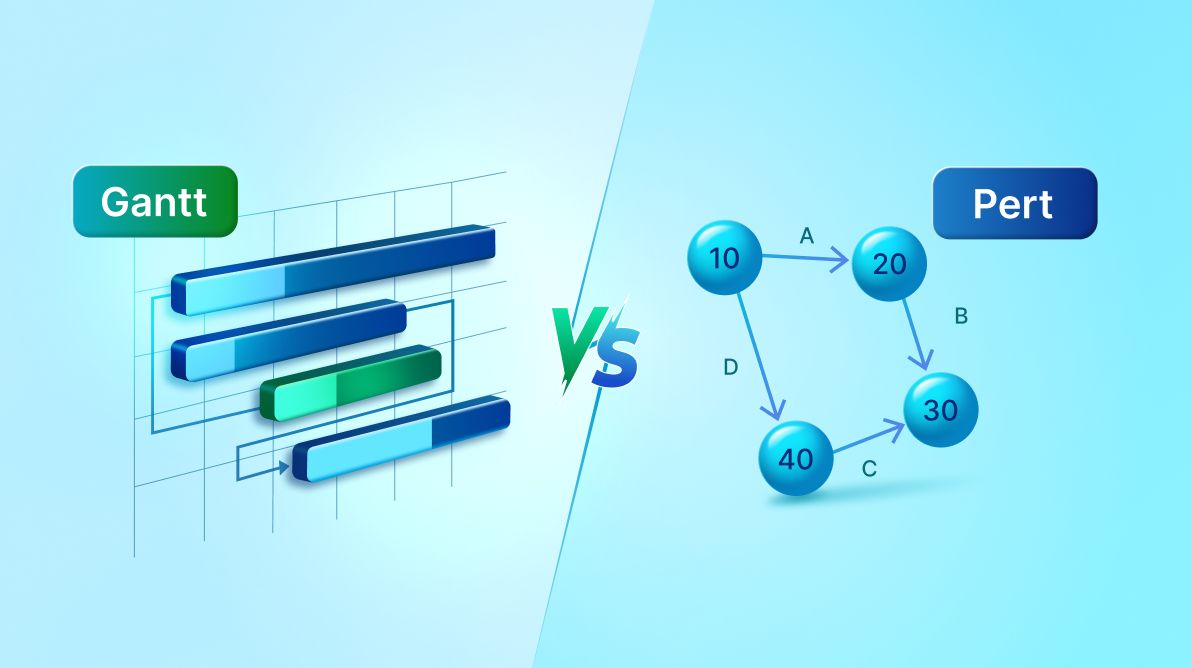
Two popular options, Gantt charts and PERT charts, offer unique strengths. Yet, misconceptions persist: some think Gantt charts are outdated, while others assume PERT charts are simpler for dependency mapping.
This blog clears up the confusion and explains why modern Gantt tools, such as Syncfusion Angular Gantt, deliver a comprehensive and user-friendly solution for end-to-end project management.
Exploring the roles of Gantt and PERT Charts
Effective project management begins with tools that align with your project’s workflow. Both Gantt and PERT charts serve distinct purposes, but understanding their differences ensures you choose the right one for your workflow.
Role and usage of PERT Charts
Program evaluation and Review Technique (PERT) charts are ideal for planning of complex projects with uncertain timelines.
Key features include:
- Task dependency mapping: PERT charts use nodes and arrows to illustrate task dependencies, clarifying the project’s workflow.
- Critical path analysis: They identify the longest sequence of dependent tasks, determining the minimum project duration.
- Time estimation with uncertainty: By factoring in optimistic, pessimistic, and most likely durations, PERT provides realistic timelines for uncertain tasks.
- Risk identification: Visualizing dependencies highlights potential risks or delays.
Best Use Case:
PERT charts are best for early-stage planning and risk analysis.
Role and usage of Gantt Chart
Gantt chart provide a timeline-based, comprehensive view of projects, making them indispensable across the entire project lifecycle:
- Schedule visualization: Tasks appear as bars on a timeline, clearly showing start and end dates.
- Dependency management: Modern Gantt charts support task dependencies (e.g., Finish-to-Start, Start-to-Start).
- Critical path tracking: Highlight critical tasks that directly impact project deadlines.
- Flexible task management: Allows unscheduled tasks and later scheduling.
- Progress and resource monitoring: Real-time updates track task completion and resource allocation.
- Interactivity: Features like drag-and-drop rescheduling and inline editing enable rapid adjustments.
While PERT charts are valuable for planning and risk analysis, Gantt charts provide a versatile, all-in-one solution for planning, execution, and monitoring. Tools like Syncfusion Angular Gantt combine dependency management, real-time tracking, and resource allocation, reducing the need for multiple tools.
Feature comparison: Gantt Chart vs. PERT Chart via Syncfusion Angular
This section compares Syncfusion Angular Gantt for Gantt chart and Syncfusion Angular Diagram for PERT charts to help teams choose based on scheduling, interactivity, and visualization needs.
1. Purpose and use case
| Aspect | Syncfusion Angular Gantt | Syncfusion Angular Diagram |
| Primary use | Project scheduling, task tracking, and resource management | Visual modeling of workflows, structures, or diagrams |
| Ideal for | Agile sprints, construction timelines, product roadmaps | PERT charts, flowcharts, org charts, process modeling |
| Project lifecycle support | Full lifecycle: plan → assign → execute → track | Early-stage planning and visualization only |
2. Scheduling and time management
| Aspect | Syncfusion Angular Gantt | Syncfusion Angular Diagram |
| Task scheduling | Start/end dates, durations, milestone tracking | Not supported |
| Timeline view | Built-in calendar-based timeline | Canvas only, no timeline concept |
| Calendar awareness | Supports workdays, holidays, weekends | No date/time integration |
| Drag-and-drop rescheduling | Tasks can be moved along the timeline | Nodes reposition only; not date-aware |
3. Task dependencies and structure
| Aspect | Syncfusion Angular Gantt | Syncfusion Angular Diagram |
| Dependencies | FS, SS, SF, FF dependency types with visual connectors | Only visual connectors; no scheduling logic |
| Critical path support | Auto-calculated and highlighted | Not supported |
| Hierarchical task view | Task > Subtask (Work Breakdown Structure) | Node hierarchy supported, but manual |
4. Tracking and monitoring
| Aspect | Syncfusion Angular Gantt | Syncfusion Angular Diagram |
| Progress tracking | % complete, Gantt bars with real-time updates | Not available |
| Resource management | Assign users/resources and track workload | No resource concepts |
| Status indicators | Progress bars, late markers, baselines | Must be manually simulated |
5. Interactivity and editing
| Aspect | Syncfusion Angular Gantt | Syncfusion Angular Diagram |
| Inline editing | Update tasks directly in the grid or timeline | Edit node text, connectors, and positions |
| Drag-and-drop | Reschedule tasks visually | Reposition and link nodes freely |
| Zoom & pan | Timeline zoom and scroll | Canvas zoom/pan support with mouse & touch |
| Undo/redo | Build-in support | Built-in for diagram interactions |
6. Data binding and integration
| Aspect | Syncfusion Angular Gantt | Syncfusion Angular Diagram |
| Data binding | Full support with REST/JSON CRUD | Requires custom implementation |
| Live updates | Sync with APIs, track updates in real time | Manual handling needed |
| Export options | Excel, PDF, CSV | Image (PNG, SVG), PDF |
Now that we’ve seen the difference between Gantt and PERT charts, let’s see how they come to life through simple, practical examples.
Simplifying complex scheduling with Syncfusion Angular Gantt
Many developers assume Gantt charts are hard to configure for multi-phase projects. The truth? Modern tools like Syncfusion Angular Gantt make it surprisingly simple with intuitive setup, powerful features, and seamless Angular integration.
Streamlined setup with hierarchical clarity
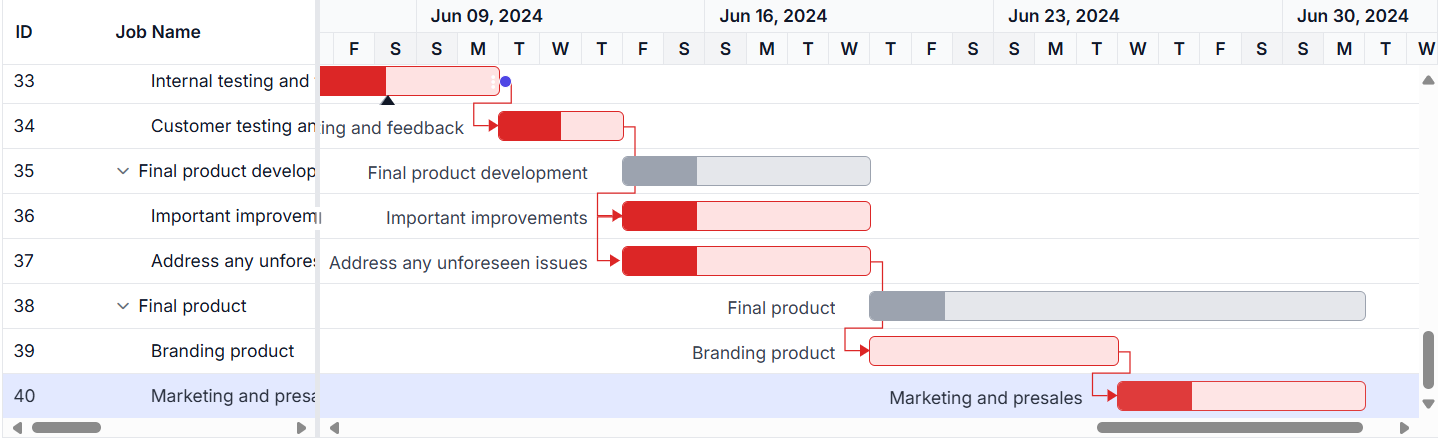
Syncfusion Angular Gantt integrates effortlessly into Angular applications, allowing teams to create detailed schedules with minimal effort. Its Work Breakdown Structure (WBS) support helps break large projects into manageable sub-tasks, giving clear visibility into phases, dependencies, and relationships.
Quick example: Enabling critical path
Here’s a basic example of setting up a Gantt chart with critical path enabled using Syncfusion Angular Gantt:
import { Component, OnInit} from '@angular/core';
import { projectNewData } from './data';
import { GanttAllModule } from '@syncfusion/ej2-angular-gantt';

@Component({
    selector: 'app-root',
    templateUrl:
        <ejs-gantt id="ganttCritical [dataSource]="data" [taskFields]="taskSettings" [enableCriticalPath]="true"
 [treeColumnIndex]="1" height="400px">
        </ejs-gantt>,
    standalone: true,
    imports: [ GanttAllModule, ]
})
export class AppComponent {
    public data: object[];
    public taskSettings: object;
    public ngOnInit(): void {
        this.data = projectNewData;
        this.taskSettings = {
            id: 'TaskID',
            name: 'TaskName',
            startDate: 'StartDate',
            endDate: 'EndDate',
            duration: 'Duration',
            progress: 'Progress',
            dependency: 'Predecessor',
            child: 'subtasks'
        };
    }
} 
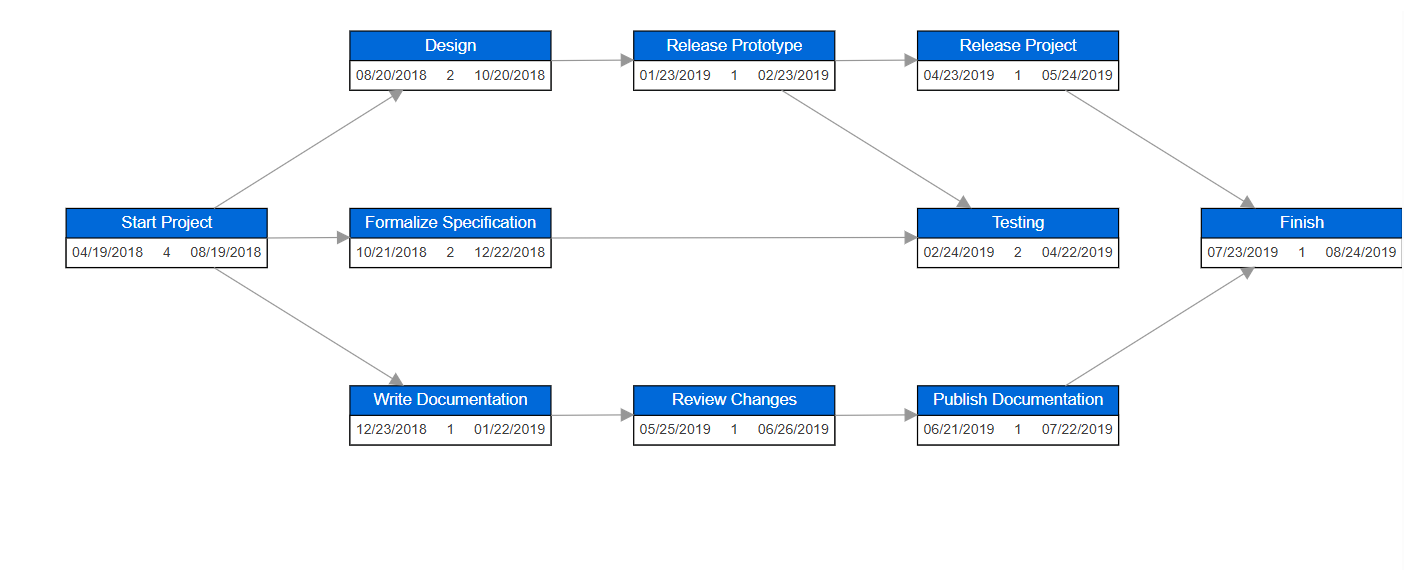
Creating a PERT Chart with Syncfusion Angular Diagram
For projects with uncertain timelines, Syncfusion Angular Diagram helps visualize task dependencies and risks through PERT charts. It’s ideal for early planning and dependency mapping. For comparison, here’s an example of creating a basic PERT chart using Syncfusion Angular Diagram:
import { Component, ViewEncapsulation, ViewChild } from '@angular/core';
import { DiagramComponent, DiagramModule } from '@syncfusion/ej2-angular-diagrams';
import {
    Diagram, NodeModel, DataBinding, DiagramElement, StackPanel, VerticalAlignment,
    SnapConstraints, TextStyleModel, TextElement, HorizontalAlignment, DiagramTools,
    HierarchicalTree, ComplexHierarchicalTree, ConnectorModel, SnapSettingsModel, randomId
} from '@syncfusion/ej2-diagrams';
import { DataManager } from '@syncfusion/ej2-data';
import { pertChartData } from './diagram-data';

export interface DataInfo {
    [key: string]: string;
}

// Injecting necessary features into the Diagram component
Diagram.Inject(DataBinding, HierarchicalTree, ComplexHierarchicalTree);

/**
* Sample for PERT Chart
*/
@Component({
    selector: 'app-root',
    templateUrl: `
        <ejs-diagram #diagram id="diagram" width="100%" height="499px" [tool]="tool" (created)="create($event)" [layout]="layout" [dataSourceSettings]="data" [getConnectorDefaults]="connectorDefaults" [snapSettings]="snapSettings" [setNodeTemplate]="setNodeTemplate">
        </ejs-diagram>
    `,
    encapsulation: ViewEncapsulation.None,
    standalone: true,
    imports: [DiagramModule]
})
export class AppComponent {
    @ViewChild('diagram') public diagram: DiagramComponent;

    // Data source configuration for the diagram
    public data: Object = {
        id: 'id',
        parentId: 'Category',
        dataSource: new DataManager(pertChartData),
        doBinding: (nodeModel: NodeModel, data: object, diagram: Diagram) => {
            nodeModel.shape = { type: 'Text' };
        }
    };

    // Layout configuration for the diagram
    public layout: Object = {
        type: 'ComplexHierarchicalTree',
        orientation: 'LeftToRight',
        verticalSpacing: 100,
        horizontalSpacing: 70
    };

    // Connector defaults configuration
    public connectorDefaults(connector: ConnectorModel): ConnectorModel {
        connector.style.strokeColor = '#979797';
        connector.targetDecorator.width = 10;
        connector.targetDecorator.height = 10;
        connector.targetDecorator.style = {
            fill: '#979797',
            strokeColor: '#979797'
        };
        return connector;
    }

    // Tool configuration for the diagram
    public tool: DiagramTools = DiagramTools.ZoomPan;
    public snapSettings: SnapSettingsModel = { constraints: SnapConstraints.None };
    public setNodeTemplate: Function = this.nodeTemplate.bind(this);

    // Function to define the custom node template
    private nodeTemplate(node: NodeModel): StackPanel {
        let table: StackPanel = new StackPanel();
        table.id = randomId();
        table.style.fill = '#0069d9';
        table.orientation = 'Vertical';

        let nameKey: string = 'id';
        let stack: StackPanel = new StackPanel();
        stack.id = randomId();
        stack.children = [];
       .orientation = 'Horizontal';
        stack.horizontalAlignment = 'Stretch';

        this.addRows(stack, node);

        table.children = [
            this.getTextElement((node.data as DataInfo)[nameKey], 'Stretch', 170, 'Stretch'),
            stack
        ];

        const textStyle = table.children[0].style as TextStyleModel;
        textStyle.color = 'white';
        element with specified properties
    private getTextElement(
        text: string,
        horizontalAlignment: HorizontalAlignment,
        width?: number,
        verticalAlignment?: VerticalAlignment
    ): DiagramElement {
        let textElement: TextElement = new TextElement();
        textElement.id = randomId();
        textElement.content = text;
        textElement.width = width;
        textElement.height = 25;
        textElement.horizontalAlignment = horizontalAlignment;
        textElement.verticalAlignment = verticalAlignment;
        textElement.style.strokeWidth = 1;
        textElement.style.strokeColor = '#b5b5b5';
        textElement.style.fill = 'transparent';
        textElement.style.color = '#3c3c3c';
        textElement.relativeMode = 'Object';
        return textElement;
    }

    // Function to fit the diagram to the page after creation
    public create(args: Object): void {
        this.diagram.fitToPage();
    }

    // Function to add rows to the stack panel
    private addRows(column: StackPanel, node: NodeModel): void {
        column.children.push(this.getTextElement((node.data as DataInfo).startDate, 'Left', 70));
        column.children.push(this.getTextElement((node.data as DataInfo).duration, 'Center', 30));
        column.children.push(this.getTextElement((node.data as DataInfo).endDate, 'Right', 70));
    }
}

Choose the right tool for your project’s success
In 2025, picking the perfect tool for your project means matching it to your goals.
- Use PERT: Syncfusion Angular Diagram for early planning of projects like research, where timelines are fuzzy and task connections matter.
- Choose Gantt: Syncfusion Angular Gantt for managing projects like apps or events with set schedules and active tracking.
- Try both: Start with PERT for mapping tasks, then switch to Gantt for execution and monitoring.
If you’re a Syncfusion user, you can download the setup from the license and downloads page. Otherwise, you can download a free 30-day trial.
You can also contact us through our support forum, support portal, or feedback portal for queries. We are always happy to assist you!


 No spam, just valuable updates.