Now, OlapChart and OlapGrid for WPF comes with the most awaited design-time support.
Normally, it would take around 10 to 15 minutes to create an Olap report if the user is not much familiar with the cube they are working with. Then, they need to bind the report to the control which needs to be render. This would be pretty hard and time consuming for big applications.
By, using the design time support available in OlapChart and OlapGrid for WPF, user can create a report easily and visualize it in our controls in a couple of minutes even in the cases of unfamiliar cubes as well.
Following steps elaborates it.
Visual Studio Designer surface:
Drag and drop the OlapChart from the visual studio toolbox. Then, “Right click” on the OlapChart. A context menu will appear.
From the context menu select “Configure data source -> Create/Edit data source… “
This will launch the wizard, using which we can configure the data source for the selected control.
![clip_image002[4] clip_image002[4]](https://blog.syncfusion.com/wp-content/uploads/2018/08/image-180.jpg)
OlapChart in Visual Studio designer with context menu
Connection Properties:
Connection properties dialog is used for create/modify the connection string. User can either choose to give server name and data source name or they can simply provide connection string. User can also, validate whether the connection string is valid or not, by hitting the “Test Connection” button.
The following image shows the connection properties window.
![clip_image002[6] clip_image002[6]](https://blog.syncfusion.com/wp-content/uploads/2018/08/image-181.jpg)
Connection properties dialog
Once, the valid connection string is built user can proceed further by hitting the next button for query designing.
Query Designer:
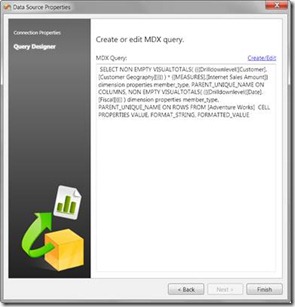
Query designer allows you to create or modify the query by means of simple drag and drop operations. If you are going to edit an existing query, it will be displayed in the MDX Query text box.

Summaries of existing or designed query
On to the top-right of the MDX Query text box, there’ll be a link “Create/Edit” click that for creating/modifying the existing query. This will launch a GUI based query designer window.

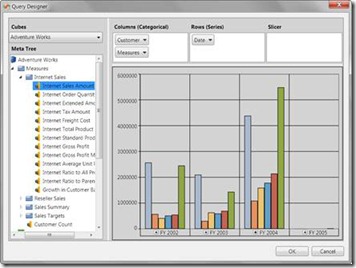
GUI based Query designer for OLAP Controls
Drag and drop dimensions, measures and KPI’s in the required axis, an immediate preview will be available for ease of visualization. Click “Ok” to save the query or “Cancel” to cancel the changes made to the query.
What we do here:
We actually, create a report as per the queries generated as a result of drag and drop operations performed in the GUI based query designer. Then, serialize the report within the control.

Typical XAML Report
All of these require, just couple of minutes only. 🙂
