
It’s not a secret that the Angular community has needed better tools to inspect the structure of Angular applications and profile their performance. Angular DevTools has been introduced for just that!
This article will go through Angular DevTools in detail and provide step-by-step guidance on making the best of it.
Angular DevTools
Angular DevTools is a browser extension introduced with Angular 12. It visualizes the structure of your app and previews the directive and component instances’ state. It gives you insight into the change detection cycles and helps you understand the app’s execution.
Angular DevTools is available for both Google Chrome and Mozilla Firefox. It supports Angular apps built with version 9 or above with Ivy enabled.

Getting Started with Angular DevTools
You can download the Chrome extension for Angular DevTools from here, and if you are a Firefox user, you can find the add-on at this link.
After installing the DevTools extension, open an Angular application that runs in development mode. There, you can see that the extension’s icon color changes from black to red, indicating that you can debug the application. Now, open the developer tools and select the Angular tab.
The running Angular version and the latest commit hash for the extension will be visible in the top-right corner of the DevTools. Additionally, as shown in the following image, when you open the DevTools, you’ll see two subtabs: Components and Profiler.

Debugging the Application
The Components subtab visualizes the application’s structure, lets you inspect the directive and component instances, and lets you preview or edit their states. In addition, you can examine the application’s component tree from here, which exhibits the hierarchical relationship between directives and the components within.
Let’s go through some of the tasks that can be carried out under this tab.
View and Modify Property Values
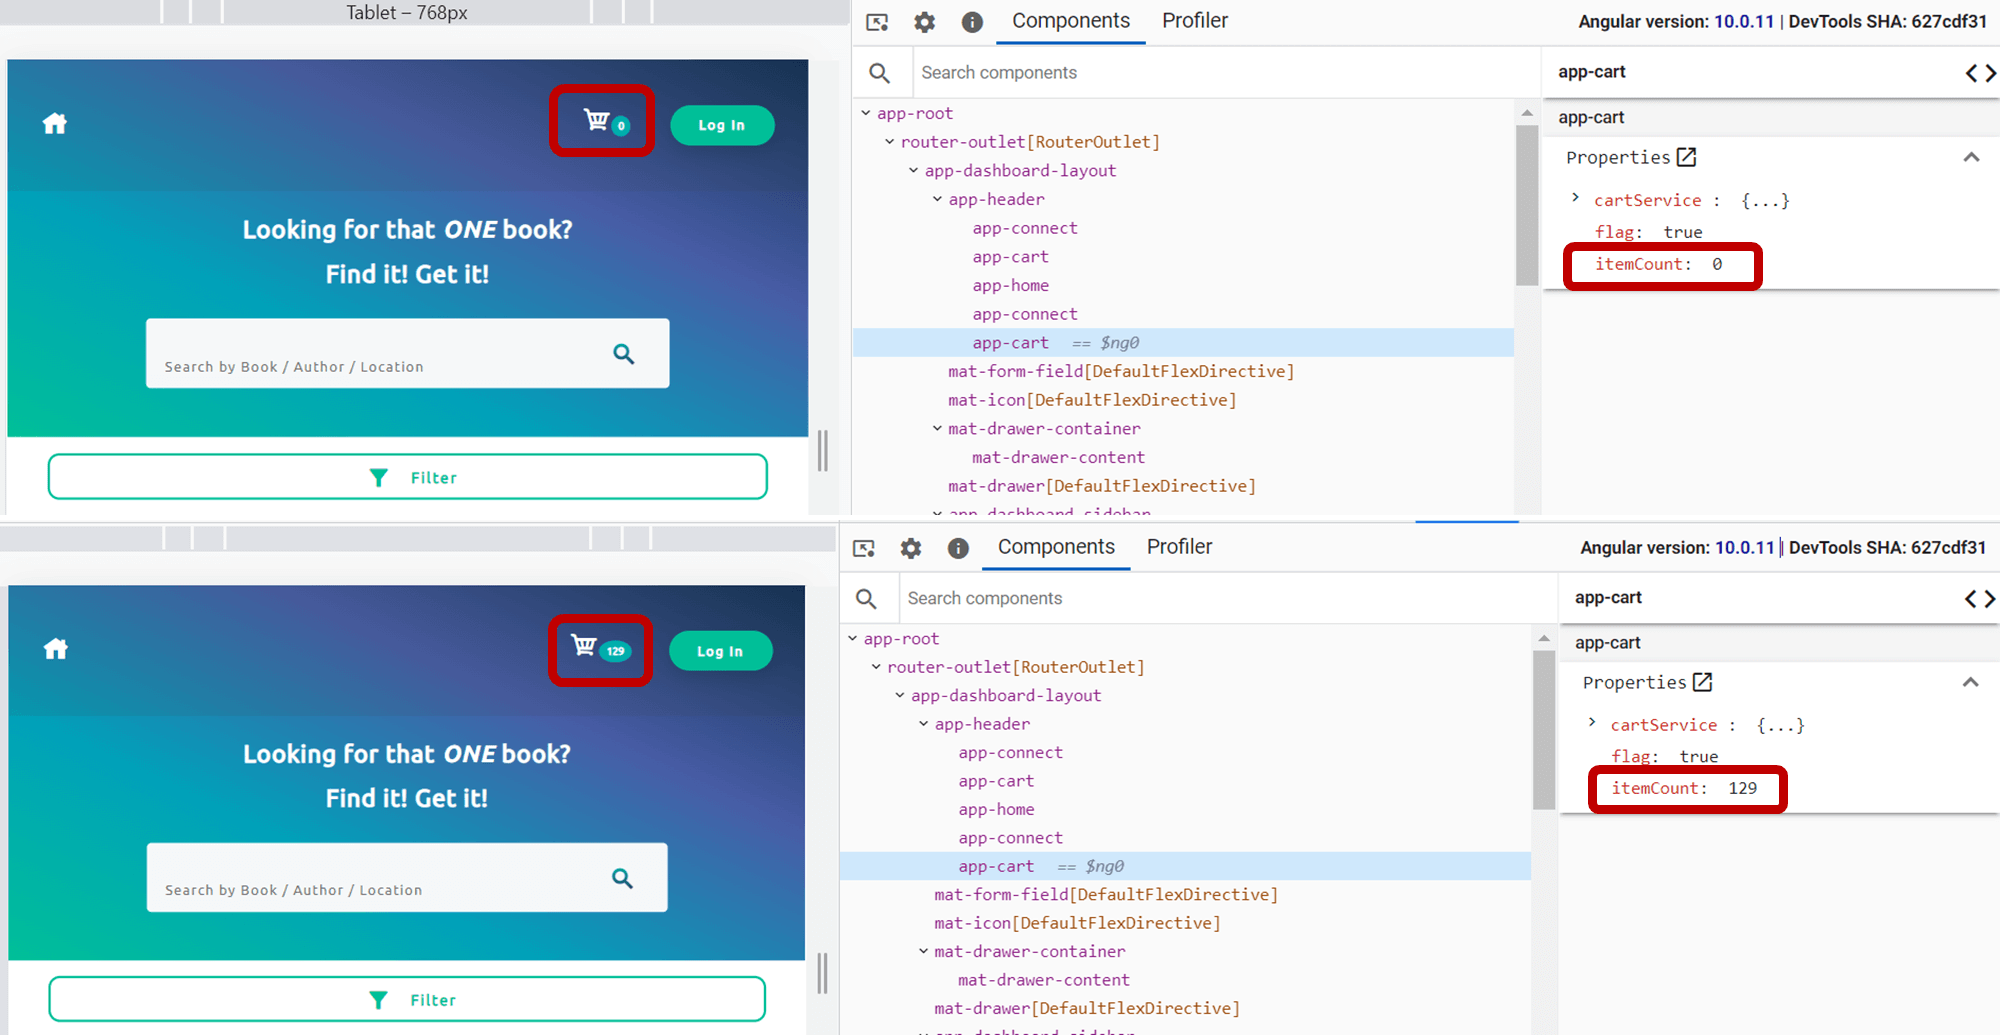
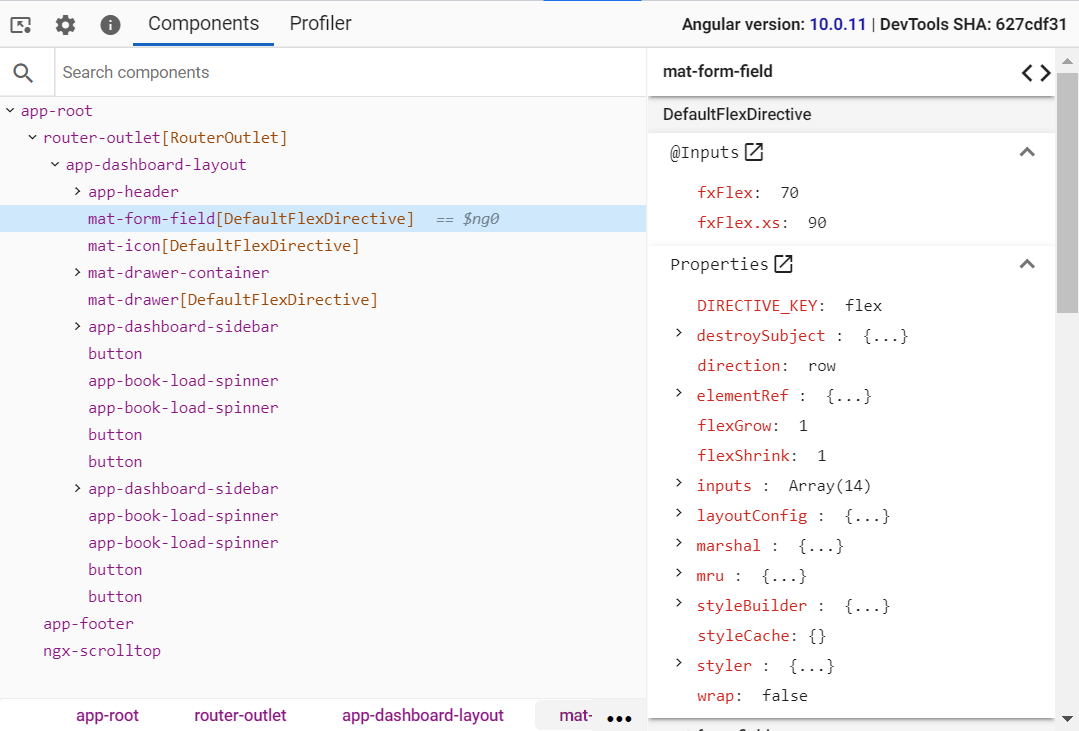 As illustrated in the screenshot, when a specific component or directive instance is selected, additional information, such as properties, metadata, inputs, and outputs, is displayed on the right panel. This panel also allows you to modify a property value and see the feedback immediately in the UI, as shown in the following image.
Note: Text input won’t be visible if the edit functionality is unavailable for a specific property value.
Look Up a Component or Directive
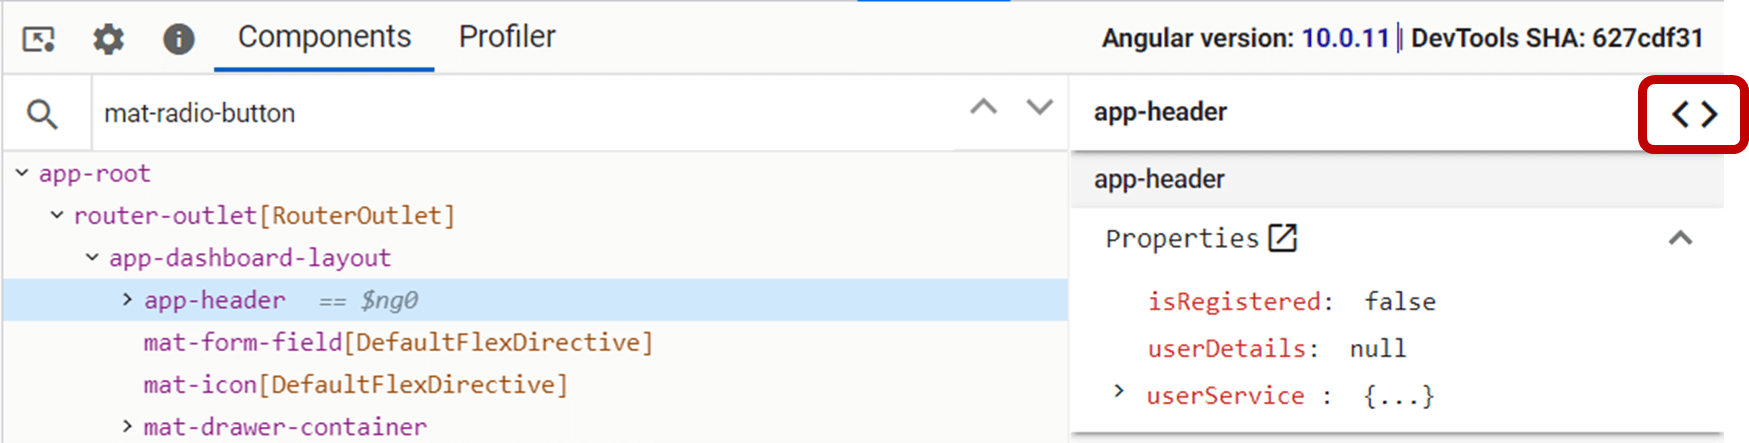
Imagine you need to jump directly to a specific directive or component using its name. You can do this simply by using the search box above the component tree. Enter and Shift + Enter keyboard shortcuts come in handy to navigate into the next and previous search matches, respectively.
Navigate to the Source Code
Angular DevTools also allow you to navigate to a particular component’s source code. After selecting a specific component, you just click on the <> icon at the top-right corner of the right panel. Then, it will navigate to the source code of the selected component.
Access the Recently Selected Component or Directive
Angular DevTools gives you access to the instances of the recently selected directives and components via the console. While $ng0 provides a reference to the currently selected instance, $ng1 works as a reference for instances chosen previously. Using this reference, you can easily read any value or method related to the referenced directive or component.
Profiling the Application
Not only can you debug an app with Angular DevTools, you can also profile your app to identify the factors that degrade its performance.
You can profile your application using the Profiler tab next to the Components tab.
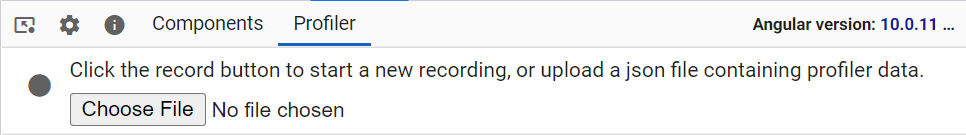 To start profiling your app, click on the Start recording icon at the top-left corner of the Profiler tab (or upload an existing recording). Then, during profiling, when you interact with the elements in the app, each event execution, such as change detection or implementation of a lifecycle hook, will be captured by the profiler. Finally, by clicking on the icon again, you can finish recording.
I will go through some of the tasks that can be carried out under this tab in detail.
Understand the Application’s Execution
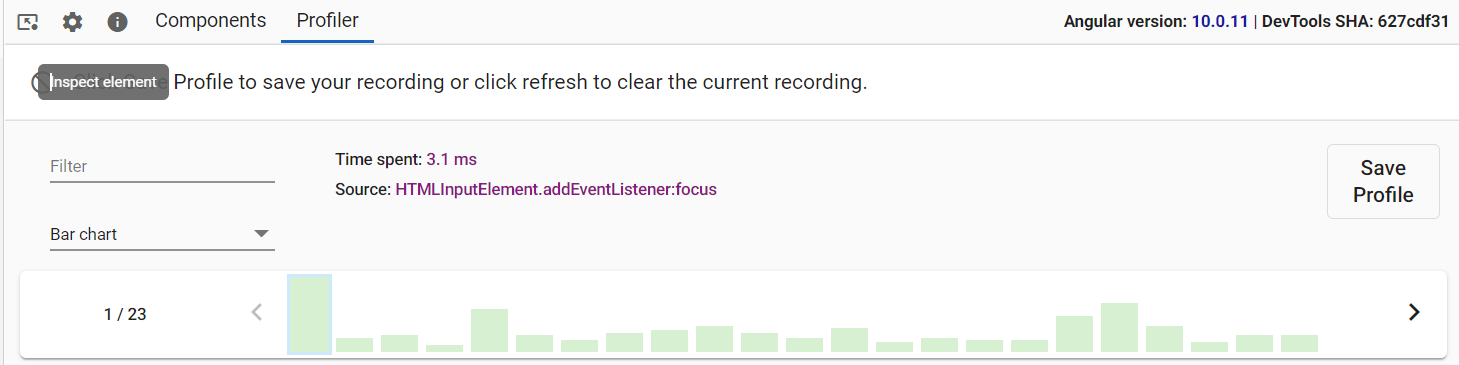 As shown in the previous screenshot, after you complete the recording, you can see a sequence of bars, each depicting a separate change detection cycle. The height of a bar represents the time you spent on each cycle.
As shown in the following screenshot, when you click on a particular bar, it will display further information, such as total time spent, the source of the change detection, and the directives and components affected by the cycle.
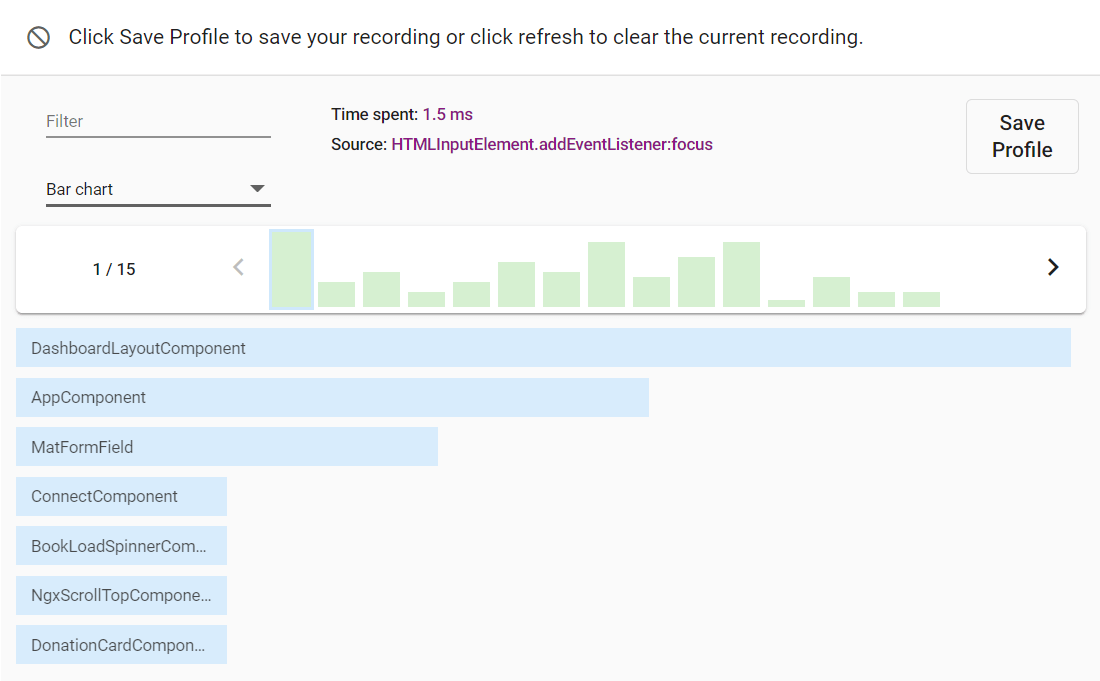 As visible in the previous screenshot, each directive or component used during the cycle is sorted based on the time it took. This can be used to find the heaviest components in your application.
Inspect the Execution of Components or Directives
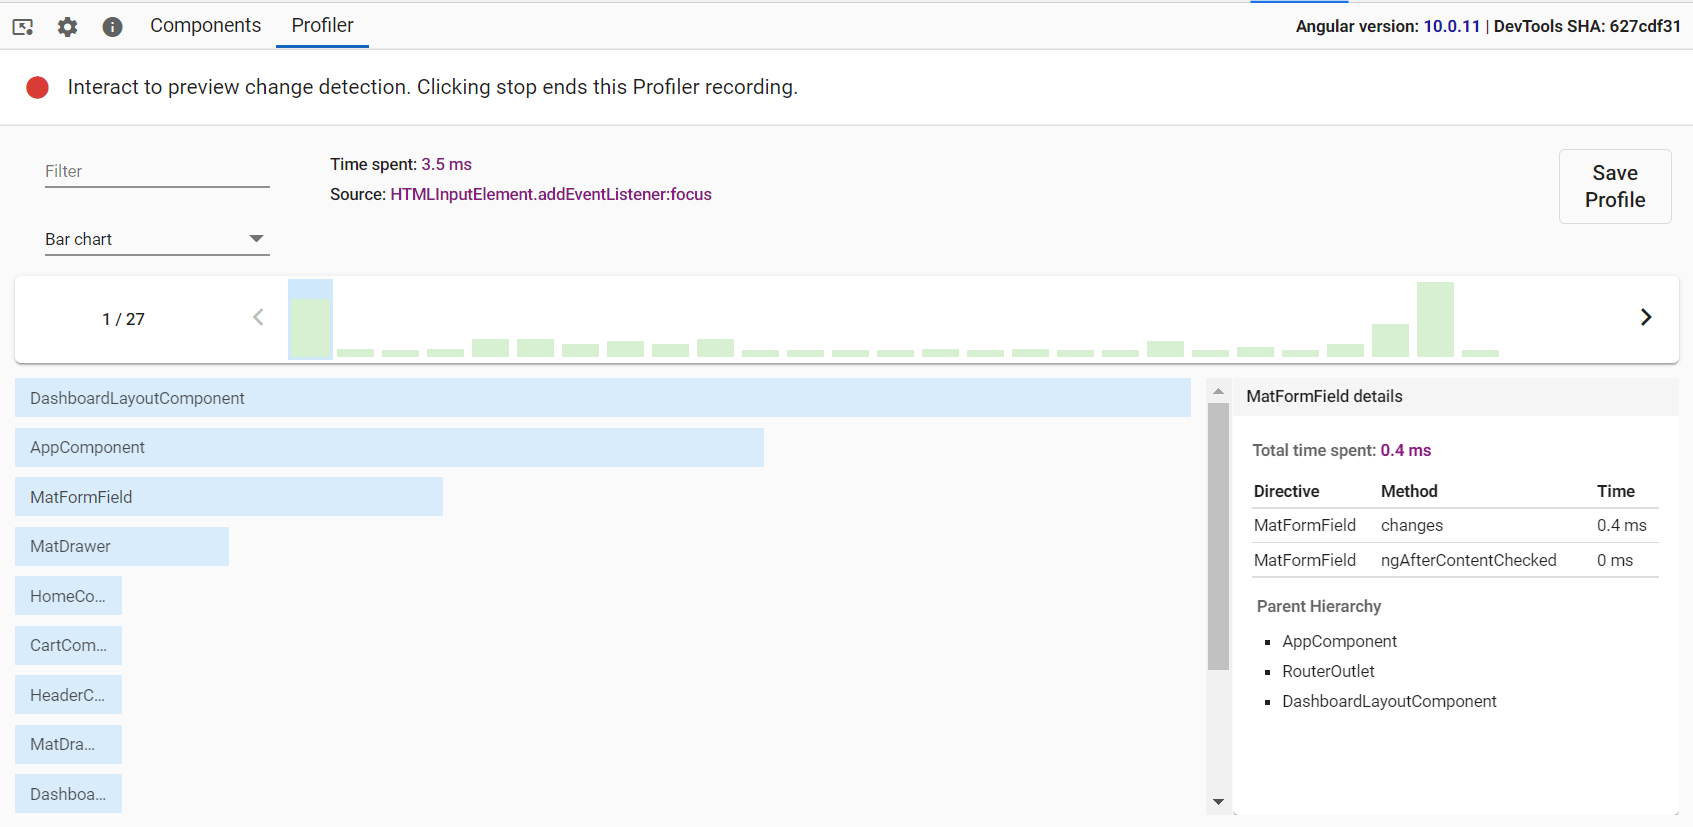
Each of these component bars displays additional information. For example, you’ll see the total time taken by each component, the exact methods triggered, and the parent hierarchy of the selected element.
Different Visualizations to Better Understand the Execution
From the bar chart view, you can switch to tree map or flame graph views to visualize the change detection to better understand your application’s execution.
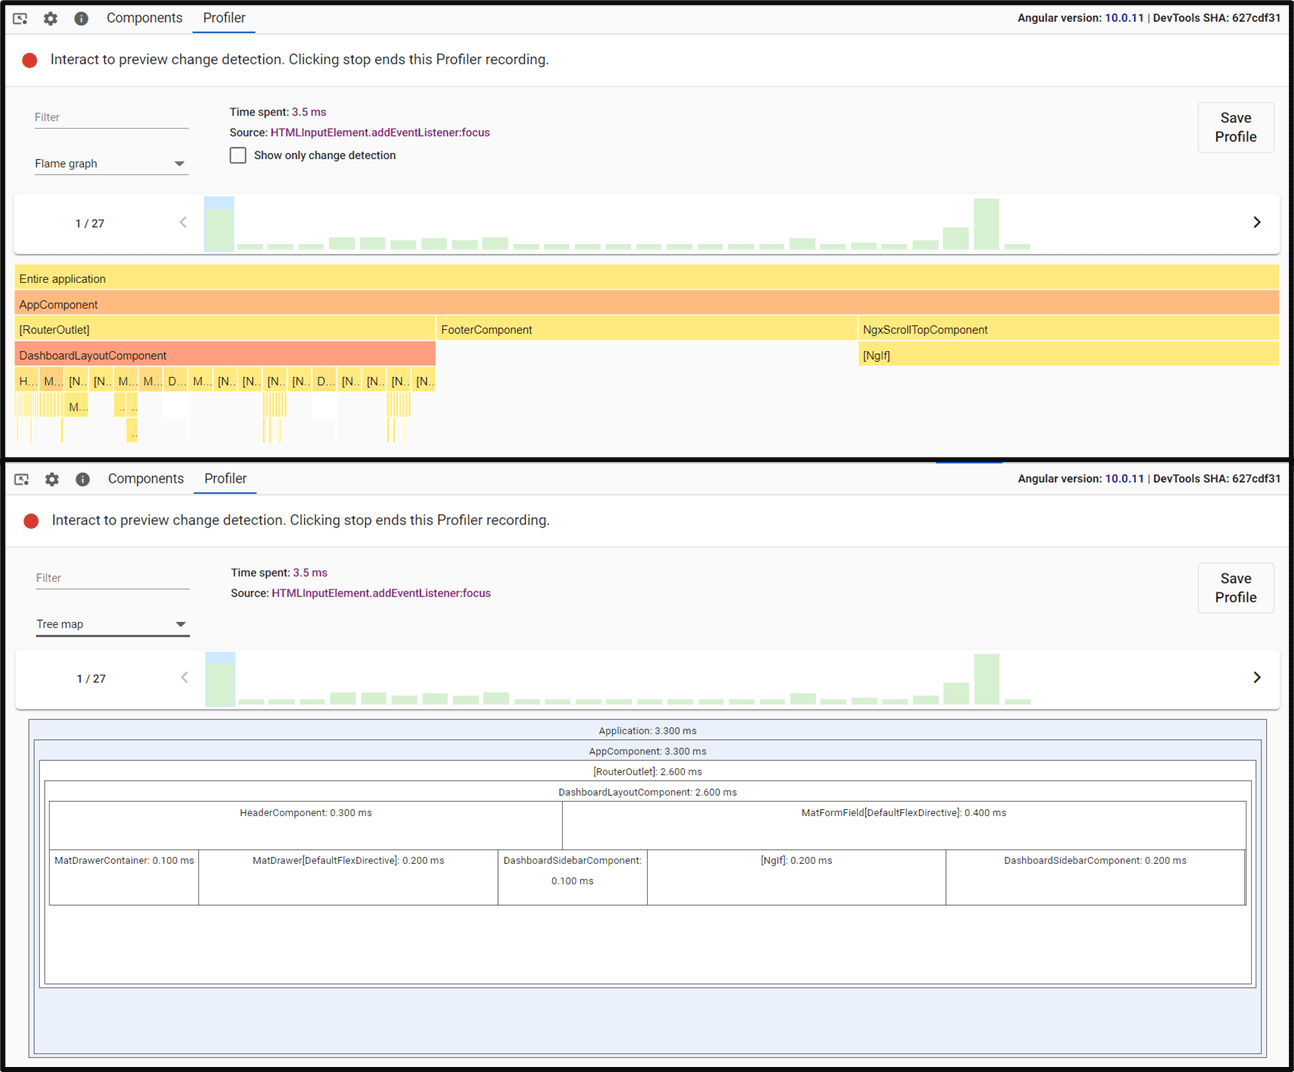
In the flame graph view, the color of each block represents the time the app spent on that component. DevTools changes the intensity of the color based on the time consumed by each component relative to the component where the app spent the most time in change detection. That means the more time an app spent on a specific component, the higher the intensity of the block color will be.
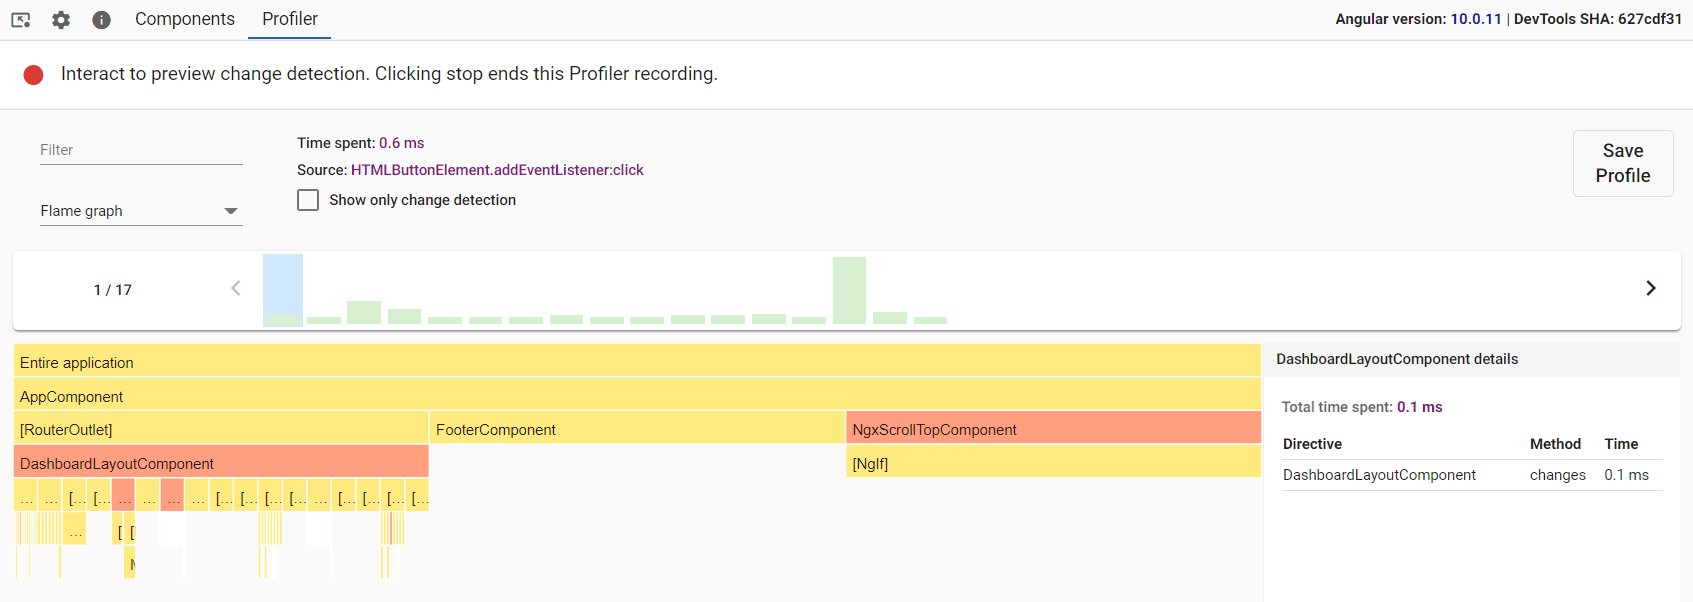 Similar to in the bar chart view, additional details will appear on a panel next to a specific block when you click on it.
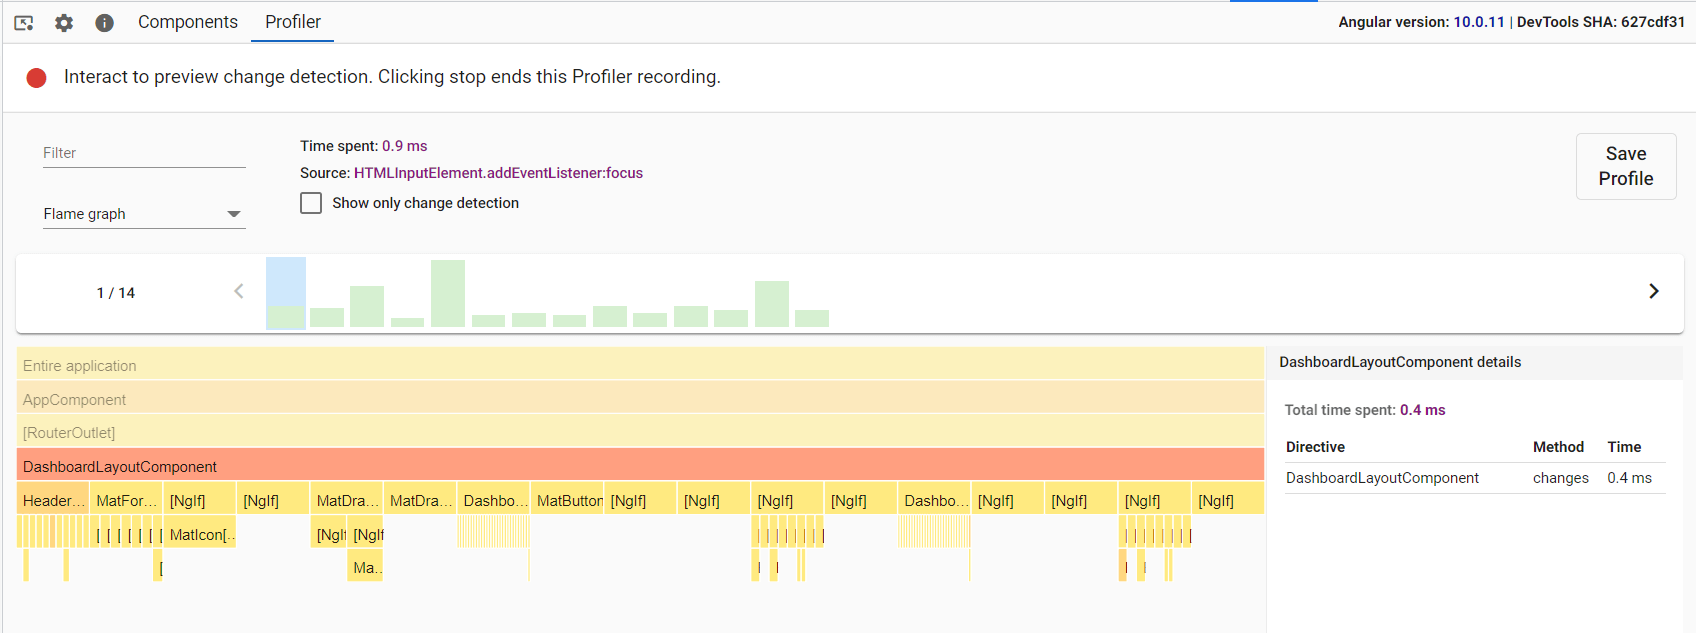
As you can see in the previous screenshot, the component and directives executed under the DashboardLayoutComponent are not clearly visible. However, you can double-click on the DashboardLayoutComponent block and zoom into it to get a clear view of its nested children.
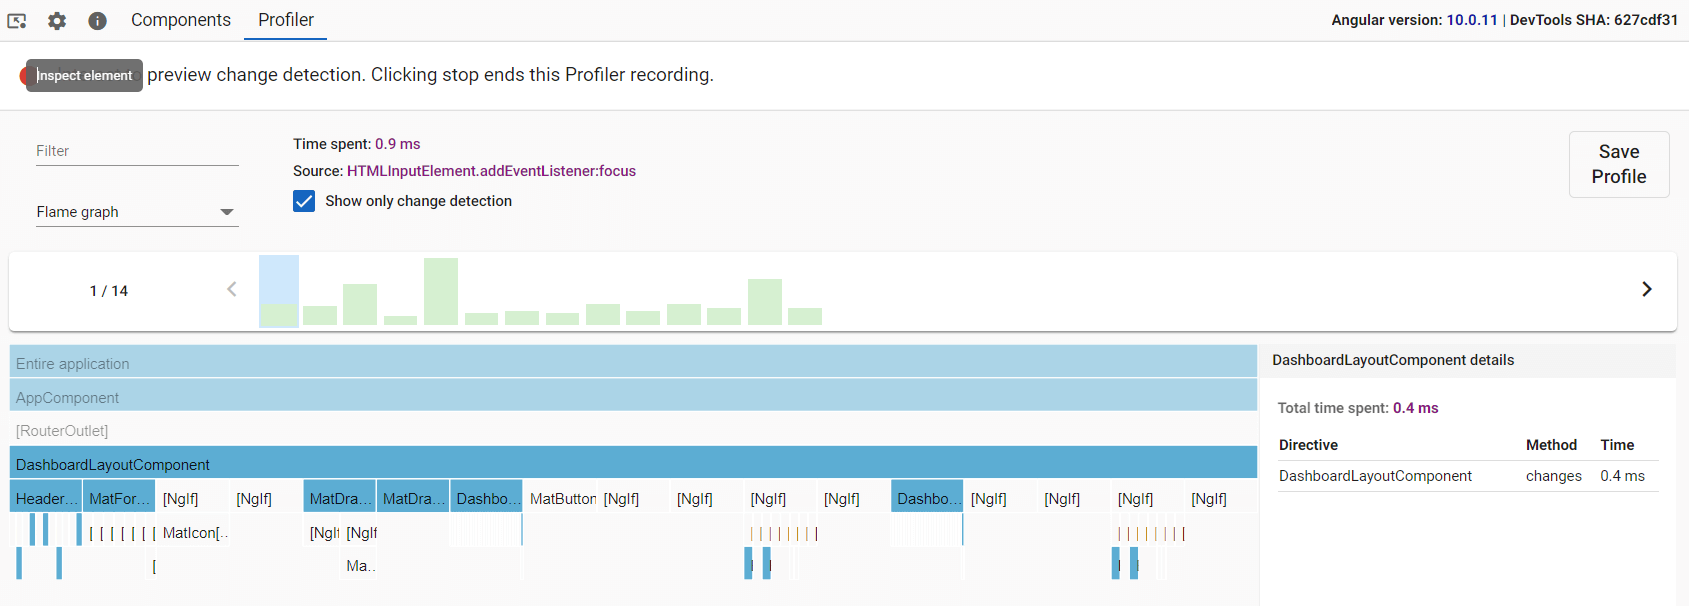
 To view only the components that were affected by the change detection, check the check box on top of the sequence of bars. It will change the color of the blocks in which changes are detected blue, while the rest will be turned gray.
 Finally, you can export the recorded profiler as a JSON file by clicking the Save Profile button at the top-right corner.
Make sure your profiler recording doesn’t contain confidential information if you share it with someone else.
Conclusion
In this article, I’ve discussed the features of Angular DevTools and how to use them. Even though it’s relatively new to the Angular community, DevTools eases your development process and brings transparency. If you still haven’t tried it out, I encourage you to do so.
Thank you for reading!
Syncfusion’s Angular UI component library is the only suite you will ever need to build an app. It contains over 75 high-performance, lightweight, modular, and responsive UI components in a single package.
For existing customers, the newest Essential Studio version is available for download from the License and Downloads page. If you are not yet a Syncfusion customer, you can try our 30-day free trial to check out the available features. Also, check out our demos on GitHub.
If you have questions, you can contact us through our support forums, support portal, or feedback portal. We are always happy to assist you!
 No spam, just valuable updates.