

The following blog post was written for Syncfusion by Brandon Minnick.
Displaying data in mobile apps using charts is common, but drawing the chart can be very difficult. It requires a lot of calculations, figuring out distances between all points, and then drawing them on the chart.
And to make matters more difficult, we need to use platform-specific iOS and Android APIs in order to draw the charts on the screen and implement touch gestures.
Let’s explore how we can leverage Syncfusion Charts to make our lives easier, requiring less math and allowing us to use cross-platform APIs in Xamarin.Forms!
Here’s where you can find completed code samples:
- CreateInteractiveCharts: The completed code from this walk-through.
- GitTrends: An iOS and Android app to monitor the Views and Clones happening on your GitHub repositories.
| Android | iOS |
 |  |
Drawing charts, before Syncfusion
To draw charts without Syncfusion, we use libraries like CoreGraphics.CGContext and CoreGraphics.CGPoint on iOS and Android.Graphics.Path and Android.Graphics.Paint on Android. These libraries are platform-specific, meaning we cannot use them in our Xamarin.Forms cross-platform UI.
For example, check out this code from XWeather, a weather app built using Xamarin.iOS and Xamarin.Android.
XWeather, iOS example
var graphRect = new CGRect (rect.X + padding, rect.Y + padding, rect.Width - (padding * 2), rect.Height - (padding * 2));
// ...
var scaleHigh = NMath.Round (highest, MidpointRounding.AwayFromZero);
var scaleLow = lowest < 0 ? NMath.Round (lowest, MidpointRounding.AwayFromZero) : NMath.Round (lowest);
// ...
var rangePadding = Settings.UomTemperature.IsImperial () ? scalePadding : (scalePadding / 2);

using var cgContex = UIGraphics.GetCurrentContext();
using var point = new CGPath ();

point.MoveToPoint(graphRect.GetMinX (), graphRect.GetMaxY ());

point.AddLines(new [] {
        new CGPoint(graphRect.GetMinX (), graphRect.GetMinY ()),
        new CGPoint(graphRect.GetMinX (), graphRect.GetMaxY ()),
        new CGPoint(graphRect.GetMaxX (), graphRect.GetMaxY ())
});

cgContex.AddPath(p);
cgContex.DrawPath(CGPathDrawingMode.Stroke);
XWeather, Android example
var graphRect = new RectF (padding, padding, canvas.Width - padding, canvas.Height - padding);

using var path = new Path();
path.MoveTo(graphRect.Left, graphRect.Top);

path.LineTo(graphRect.Left, graphRect.Bottom);
path.LineTo(graphRect.Right, graphRect.Bottom);

paint.SetStyle(Paint.Style.Stroke);

canvas.DrawPath(path, paint);
All this code, and we haven’t even touched on adding touch gestures like pan and zoom, yet.
Let’s look at how to do it with Syncfusion, instead.
Drawing charts with Syncfusion
Syncfusion makes our lives easier by using the SfCharts library. It doesn’t require any complex calculations and, best of all, is cross-platform and can be used in our Xamarin.Forms project!
Let’s look at how to install and implement SfCharts.
0. Getting started
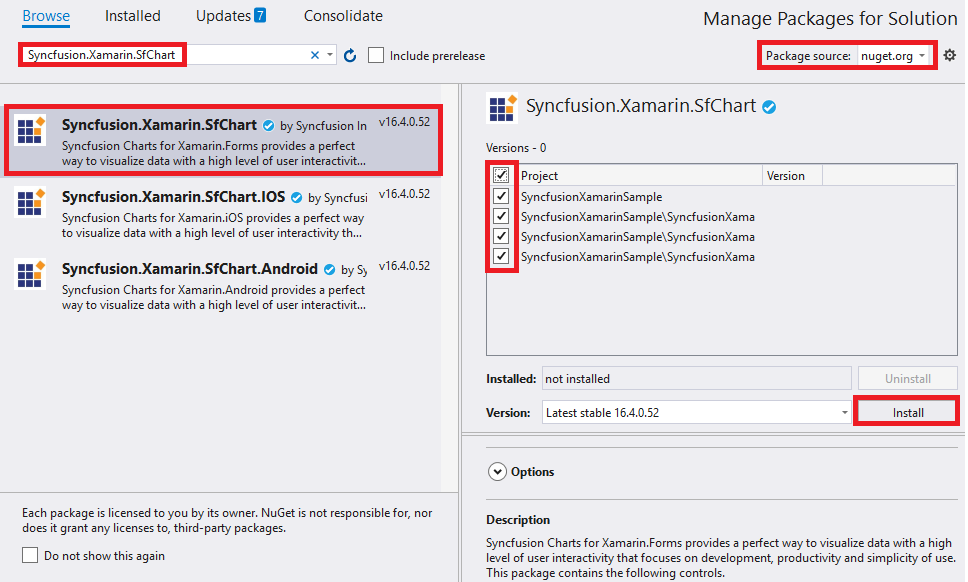
Install Syncfusion NuGet packages
Install the Syncfusion.Xamarin.SfChart NuGet package into each project, e.g., .NET Standard project, Xamarin.iOS project, and Xamarin.Android project.
Initialize Syncfusion Charts, iOS
In AppDelegate.cs, in the FinishedLaunching method, add Syncfusion.SfChart.XForms.iOS.Renderers.SfChartRenderer.Init(); after Xamarin.Forms.Forms.Init();.
Here is an example.
public class AppDelegate : Xamarin.Forms.Platform.iOS.FormsApplicationDelegate
{
    public override bool FinishedLaunching(UIApplication app, NSDictionary options)
    {
        Xamarin.Forms.Forms.Init();
        Syncfusion.SfChart.XForms.iOS.Renderers.SfChartRenderer.Init();

        LoadApplication(new App());

        return base.FinishedLaunching(app, options);
    }
}
Create data model for chart
Let’s create a new class called ChartDataModel that we’ll use as the model to hold the data for our chart.
class ChartDataModel
{
    public DateTime Date { get; set; }
    public int Value { get; set; }
}
1. Create a custom chart
Let’s start by creating a new class called AreaSeriesChart.
class AreaSeriesChart : SfChart
{
    public AreaSeriesChart()
    {
    }
}
In this class, let’s create a static method to generate data called IEnumerable<ChartDataModel> GenerateData().
class AreaSeriesChart : SfChart
{
    public AreaSeriesChart()
    {
    }

    static IEnumerable<ChartDataModel> GenerateData(int count, int maxValue)
    {
        var random = new Random();

        for (int i = 0; i < count; i++)
        {
            yield return new ChartDataModel
            {
                Date = DateTime.Now.Subtract(TimeSpan.FromDays(i)),
                Value = random.Next(maxValue)
            };
        }
    }
}
Next, in the constructor of AreaSeriesChart, let’s create an AreaSeries that will display our data.
public AreaSeriesChart()
{
    const int numberOfDays = 20;
    const int maxValue = 100;

    var areaSeries = new AreaSeries
    {
        Opacity = 0.9,
        Label = nameof(ChartDataModel),
        ItemsSource = GenerateData(numberOfDays, maxValue),
        XBindingPath = nameof(ChartDataModel.Date),
        YBindingPath = nameof(ChartDataModel.Value)
    };

    Series = new ChartSeriesCollection { areaSeries };
}
Lastly, in the constructor of AreaSeriesChart, let’s define our PrimaryAxis and SecondaryAxis.
public AreaSeriesChart()
{
    const int numberOfDays = 20;
    const int maxValue = 100;

    var areaSeries = new AreaSeries
    {
        Opacity = 0.9,
        Label = nameof(ChartDataModel),
        ItemsSource = GenerateData(numberOfDays, maxValue),
        XBindingPath = nameof(ChartDataModel.Date),
        YBindingPath = nameof(ChartDataModel.Value)
    };

    Series = new ChartSeriesCollection { areaSeries };

    PrimaryAxis = new DateTimeAxis
    {
        IntervalType = DateTimeIntervalType.Days,
        Interval = 1,
        RangePadding = DateTimeRangePadding.Round,
        Minimum = DateTime.Now.Subtract(TimeSpan.FromDays(numberOfDays - 1)),
        Maximum = DateTime.Now
    };

    SecondaryAxis = new NumericalAxis
    {
        Minimum = 0,
        Maximum = maxValue
    };
}
2. Display chart in app
First, we’ll create a new class called SyncfusionChartPage, which will inherit from Xamarin.Forms.ContentPage to display our new chart.
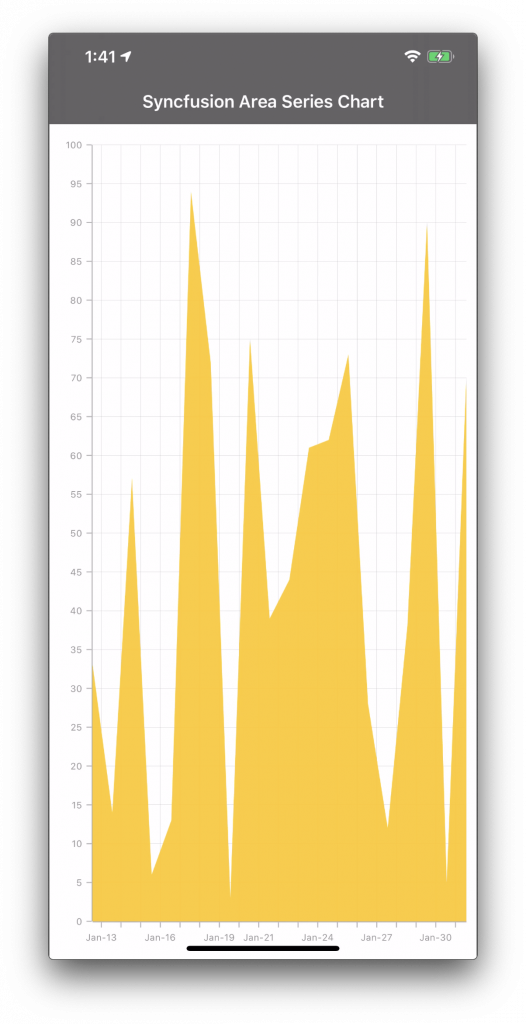
class SyncfusionChartPage : ContentPage
{
    public SyncfusionChartPage()
    {
        Title = "Syncfusion Area Series Chart";

        Padding = new Thickness(0, 10, 0, 0);

        Content = new AreaSeriesChart();
    }
}
And lastly, in App.cs, we’ll assign MainPage to be our newly created SyncfusionChartPage.
public class App : Application
{
    public App()
    {
        MainPage = new NavigationPage(new SyncfusionChartPage());
    }
}
Great! Now we have a chart in our app that displays our data.
3. Make the chart interactive
First, let’s add the ability to see the exact value of the data by adding ChartTrackballBehavior.
public AreaSeriesChart()
{
    const int numberOfDays = 20;
    const int maxValue = 100;

    var areaSeries = new AreaSeries
    {
        Opacity = 0.9,
        Label = nameof(ChartDataModel),
        ItemsSource = GenerateData(numberOfDays, maxValue),
        XBindingPath = nameof(ChartDataModel.Date),
        YBindingPath = nameof(ChartDataModel.Value)
    };

    Series = new ChartSeriesCollection { areaSeries };

    PrimaryAxis = new DateTimeAxis
    {
        IntervalType = DateTimeIntervalType.Days,
        Interval = 1,
        RangePadding = DateTimeRangePadding.Round,
        Minimum = DateTime.Now.Subtract(TimeSpan.FromDays(numberOfDays - 1)),
        Maximum = DateTime.Now
    };

    SecondaryAxis = new NumericalAxis
    {
        Minimum = 0,
        Maximum = maxValue
    };

    ChartBehaviors = new ChartBehaviorCollection
    {
        new ChartTrackballBehavior()
    };
}
Next, let’s add the ability to pan and zoom by adding ChartZoomPanBehavior.
public AreaSeriesChart()
{
    const int numberOfDays = 20;
    const int maxValue = 100;

    var areaSeries = new AreaSeries
    {
        Opacity = 0.9,
        Label = nameof(ChartDataModel),
        ItemsSource = GenerateData(numberOfDays, maxValue),
        XBindingPath = nameof(ChartDataModel.Date),
        YBindingPath = nameof(ChartDataModel.Value)
    };

    Series = new ChartSeriesCollection { areaSeries };

    PrimaryAxis = new DateTimeAxis
    {
        IntervalType = DateTimeIntervalType.Days,
        Interval = 1,
        RangePadding = DateTimeRangePadding.Round,
        Minimum = DateTime.Now.Subtract(TimeSpan.FromDays(numberOfDays - 1)),
        Maximum = DateTime.Now
    };

    SecondaryAxis = new NumericalAxis
    {
        Minimum = 0,
        Maximum = maxValue
    };

    ChartBehaviors = new ChartBehaviorCollection
    {
        new ChartZoomPanBehavior(),
        new ChartTrackballBehavior()
    };
}
And now we have an interactive chart!
If you liked this post, we think you’ll also enjoy:
[Ebook] Xamarin.Forms Succinctly
 No spam, just valuable updates.
Comments (1)
Very nice. I wonder if you have considered doing these with a SkiaSharp dependency instead of Xamarin.Forms. Then you will get Xamarin.iOS/Xamarin.Android but also all the other platforms (UWP, Mac, WPF…) both from XF and not.