
TL;DR: Learn how to generate impressive charts using AI and Syncfusion® in .NET MAUI by simply describing your data needs in natural language. Streamline your workflow with automatic JSON configurations and real-time updates.
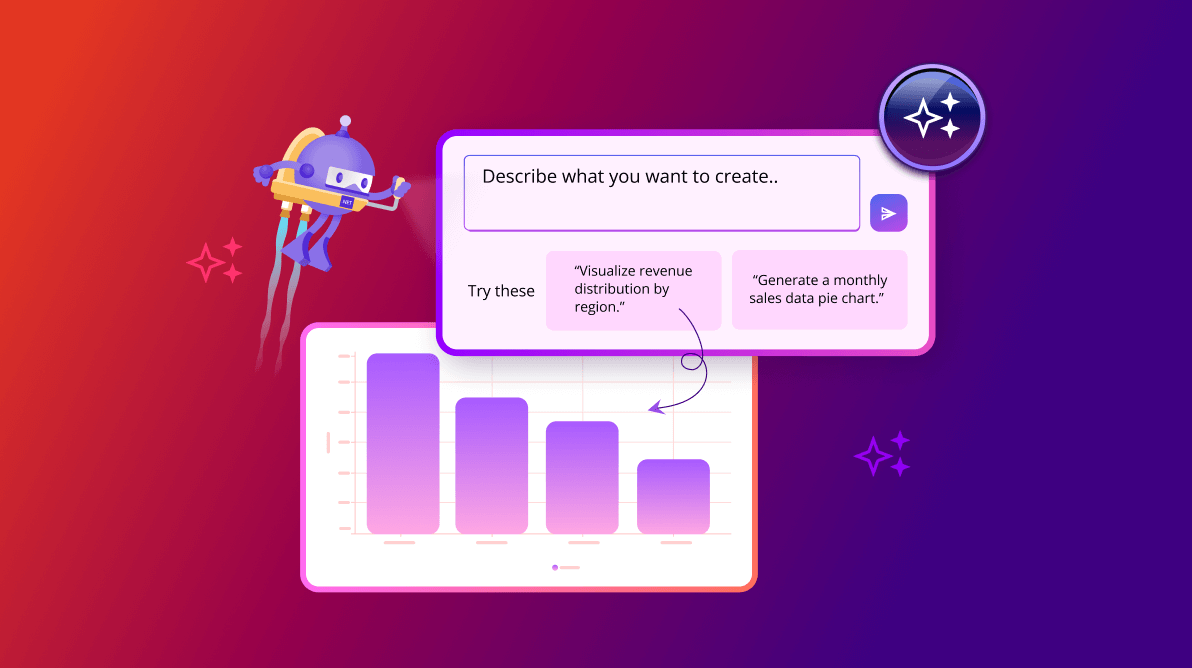
Imagine describing your data visualization needs in plain English and instantly receiving a stunning chart without any coding required! This is now a reality, thanks to the integration of AI with Syncfusion® robust .NET MAUI Charts control.
In this blog, we’ll explore how you can effortlessly generate charts in .NET MAUI using natural language input. For an introduction to our JSON-based auto-chart generation process, feel free to check out our previous blog to understand the foundation of this feature.
Why choose Natural Language chart generation?
- User-friendly: No technical expertise is needed—just describe your data.
- Time-saving: Let AI handle chart creation and customization instantly.
- Effortless workflow: Combine AI with Syncfusion® Charts for seamless data visualization.
- Dynamic flexibility: Generate a variety of chart types from a single input.
How does it work?
- AI-powered JSON generation: The AI processes natural language input and generates chart configurations in JSON format.
- JSON-to-chart conversion: JSON configurations are converted into chart visuals using Syncfusion® .NET MAUI Charts.
- In-place modifications: With the Syncfusion® .NET MAUI AI AssistView, you can dynamically update and refine the chart.
Setting up Natural Language Processing with AI
To implement this feature, we leverage the Microsoft.Extensions.AI.OpenAI package. Install the package using the following command.
dotnet add package Microsoft.Extensions.AI.OpenAI
Implementing the AI service
The ChartAIService class handles Azure OpenAI credentials, validates them, and fetches AI responses.
Key features
- Credential validation: Ensures that the Azure API key and endpoint are configured correctly.
- AI response retrieval: Converts user prompts into AI-generated JSON configurations.
Refer to the following code example.
internal class ChartAIService
{
    #region Fields
    internal const string endpoint = "https://YOUR_ACCOUNT.openai.azure.com/";
    internal const string deploymentName = "deployment name";
    internal const string imageDeploymentName = "IMAGE_MODEL_NAME";
    internal const string key = "API key";
    private static bool isAlreadyValidated;
    private Uri? uriResult;
    #endregion

    public ChartAIService()
    {
        ValidateCredential();
    }

   #region Properties
    internal IChatClient? Client { get; set; }

    internal string? ChatHistory { get; set; }

    internal static bool IsCredentialValid { get; set; }
    #endregion

    #region Private Methods
    // Validate Azure Credentials
    private async void ValidateCredential()
    {
        this.GetAzureOpenAIKernal();

        if (isAlreadyValidated)
        {
            return;
        }

        try
        {
            if (Client != null)
            {
                await Client!.CompleteAsync("Hello, Test Check");
                ChatHistory = string.Empty;
                IsCredentialValid = true;
                isAlreadyValidated = true;
            }
            else
            {
                ShowAlertAsync();
            }
        }
        catch (Exception)
        {
            return;
        }
    }

    #region Azure OpenAI
    // To get the Azure open ai kernal method
    private void GetAzureOpenAIKernal()
    {
        try
        {
            var client = new AzureOpenAIClient(new Uri(endpoint), new AzureKeyCredential(key)).AsChatClient(modelId: deploymentName);
            this.Client = client;
        }
        catch (Exception)
        {
        }
    }
    #endregion

    // Show Alert Popup
    private async void ShowAlertAsync()
    {
        var page = Application.Current?.Windows[0].Page;
        if (page != null && !IsCredentialValid)
        {
            isAlreadyValidated = true;
            await page.DisplayAlert("Alert", "The Azure API key or endpoint is missing or incorrect. Please verify your credentials. You can also continue with the offline data.", "OK");
        }
    }
    #endregion
}
Then, replace the placeholders, such as YOUR_ACCOUNT and Your_API_key with your actual Azure OpenAI credentials.
// Retrieves an answer from the deployment name model using the provided user prompt.
    internal async Task<string> GetAnswerFromGPT(string userPrompt)
    {
        try
        {
            if (IsCredentialValid && Client != null)
            {
                ChatHistory = string.Empty;
                // Add the system message and user message to the options
                ChatHistory = ChatHistory + userPrompt;
                var response = await Client.CompleteAsync(ChatHistory);
                return response.ToString();
            }
        }
        catch
        {
            // If an exception occurs (e.g., network issues, API errors), return an empty string.
            return "";
        }

        return "";
    }
Crafting effective AI prompts
To ensure accurate and cost-effective responses, we request JSON configurations instead of direct chart logic.
public async Task<string> GetAIResponse(string query)
        {
            string prompt = "Create a JSON configuration for a cartesian chart using the ChartConfig and SeriesConfig classes, "
                + $"based on the following query: {query}. The JSON should include: "
                + "1. The chart type (cartesian or circular). "
                + "2. Title of the chart. "
                + "3. X-axis and Y-axis specifications (for cartesian charts). "
                + "4. Series configurations, including type and data source. "
                + "5. A setting for whether tooltips are enabled. "
                + "Use exemplary data relevant to the query to fill in the values. "
                + "Example JSON Structure: "
                + "{ "
                + "  chartType: cartesian, // or circular"
                + "  title: {Chart Title}, // Replace with an appropriate title"
                + "  ShowLegend: true "
                + "  series: [ "
                + "    { "
                + "      type: line, // Specify type: line, area, column, pie, doughnut or radialbar etc."
                + "      xpath: xvalue, "
                + "      dataSource: [ "
                + "        { xvalue: {X1}, yvalue: {Y1} },    // Sample data points"
                + "        { xvalue: {X2}, yvalue: {Y2} },   //  Keys should always be xvalue and yvalue. All other keys are not allowed."
                + "        { xvalue: {X3}, yvalue: {Y3} }   //   Real-world data is preferred over sample data"
                + "      ], "
                + "      tooltip: true "
                + "    } "
                + "  ], "
                + "  xAxis: { "
                + "    type: category, // For cartesian charts"
                + "    title: {X Axis Title} // Optional: Replace with an appropriate title"
                + "  }, "
                + "  yAxis: { "
                + "    title: {Y Axis Title}, // Optional: Replace with an appropriate title"
                + "    type: numerical, // For cartesian charts"
                + "    min: {Min Value}, // Optional: set minimum value if relevant"
                + "    max: {Max Value} // Optional: set maximum value if relevant"
                + "  }, "
                + "} "
                + "Instructions: "
                + "- Replace placeholders such as `{query}`, `{Chart Title}`, `{X1}`, `{Y1}`, `{X Axis Title}`, and `{Y Axis Title}` with actual data relevant to the query. "
                + "- Choose the appropriate chart and series types based on the data. "
                + "- Ensure the data format matches the requirements for cartesian charts. "
                + "- Only plain text should be used; no need to specify 'json' above the data. "
                + "- No additional content other than json data should be included!";

            // Call the method to get the AI response
            var response = await openAIService.GetAnswerFromGPT(prompt);

            // Convert the response to a string (assuming the response has a ToString method)
            return response.ToString();
        }
Reusing JSON-to-chart logic
The AI-generated JSON integrates seamlessly with the JSON-to-chart logic discussed in our previous blog. This modular approach leverages existing functionality, thus avoiding duplication.
Enhancing with .NET MAUI AI AssistView
The .NET MAUI AI AssistView enables real-time interaction with the AI service, allowing for dynamic chart updates. To use this feature, install the package using the following command.
dotnet add package Syncfusion.Maui.AIAssistView --version 28.1.37
ViewModel setup
C#
public ICommand RequestCommand { get; }
public ObservableCollection<IAssistItem> Messages { get; set; }
XAML
xmlns:aiassistview="clr-namespace:Syncfusion.Maui.AIAssistView;assembly=Syncfusion.Maui.AIAssistView"
...

<aiassistview:SfAIAssistView
    IsVisible="{Binding ShowAssistView, Mode=TwoWay}"
    x:Name="aiAssistView"
    RequestCommand="{Binding RequestCommand}"
    ShowHeader="{Binding ShowHeader}"
    AssistItems="{Binding Messages}">

    <aiassistview:SfAIAssistView.HeaderTemplate>
        <DataTemplate>
            <VerticalStackLayout Spacing="12">
                <Label
                    Text="How can I assist with generated chart?"
                    Padding="0,20,0,0"
                    LineBreakMode="WordWrap"
                    FontSize="Subtitle"
                    HorizontalOptions="Center" />

                <HorizontalStackLayout
                    x:Name="listView"
                    HeightRequest="{OnPlatform WinUI=140, Android=160, MacCatalyst=180, iOS=150}"
                    WidthRequest="{OnPlatform MacCatalyst=430, Android=335, iOS=310}"
                    HorizontalOptions="Center"
                    BindableLayout.ItemsSource="{Binding Path=ModelPrompts}">
                </HorizontalStackLayout>
            </VerticalStackLayout>
        </DataTemplate>
    </aiassistview:SfAIAssistView.HeaderTemplate>

    <aiassistview:SfAIAssistView.Shadow>
        <Shadow
            Brush="Black"
            Offset="0,0"
            Radius="1"
            Opacity="0.5" />
    </aiassistview:SfAIAssistView.Shadow>

</aiassistview:SfAIAssistView>
Now, refer to the following code example to configure the message service with AI AssistView.
RequestCommand = new Command<object>(OnRequest);

...

internal async void OnRequest(object requestText)
{
    var value = ((RequestEventArgs)requestText).RequestItem.Text;
    OnRequest(value);
}

internal async void OnRequest(string requestText)
{
    if (!string.IsNullOrEmpty(requestText))
    {
        newJson = await ProcessUserRequest(requestText);
    }

    if (!string.IsNullOrEmpty(newJson) && newJson != oldJson)
    {
        DecryptJSON(newJson, true);
        oldJson = newJson;
    }
    else
    {
        AssistItem assistItem = new()
        {
            Text = "Invalid request. Please try again!",
            ShowAssistItemFooter = false
        };
        Messages.Add(assistItem);
    }
}

public async Task<string> ProcessUserRequest(string request)
{
    string prompt = $"Given the user's request: {request}, modify the following json data." +
                    $"json data: {oldJson}" +
                    "Instructions: " +
                    "- Accept only the possible modifications that can be made to the current json data; return empty string for unintended requests like changing the entire chart type or etc."
                    + "- Only plain text should be used; no need to specify 'json' above the data."
                    + "- No additional content other than json data should be included!";

    var response = await openAIService.GetAnswerFromGPT(prompt);

    return response.ToString();
}
Refer to the following output GIF image.
GitHub reference
Also, refer to transforming natural language inputs into charts using the AI-powered chart creator GitHub demo.

Conclusion
Thanks for reading the blog! We have explored how to effortlessly create stunning charts using AI and Syncfusion® robust .NET MAUI tools, all with natural language input. No coding is needed for dynamic chart visuals! Try it out and experience the convenience of auto-generating stunning charts with AI!
If you need assistance, please do not hesitate to contact us via our support forum, support portal, or feedback portal. We are always eager to help you!


 No spam, just valuable updates.