
TL;DR: Building responsive dashboards in Angular? Start with the right charts! This guide compares Syncfusion Charts, Highcharts, FusionCharts, ng2-charts, and ngx-echarts, covering their key features, installation steps and real-world use cases. By the end you’ll know which Angular chart library best fits your app.
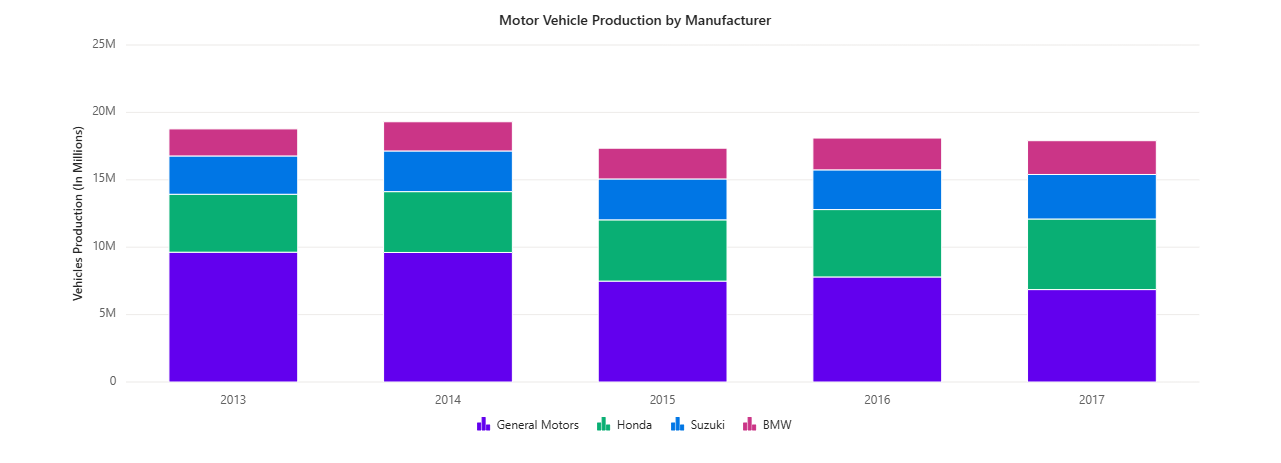
Data tells the story, but charts make it easy to understand and can help users identify trends, patterns, and insights at a glance in your app. Choosing the right Angular chart library directly impacts how effectively your users interact with data.
This post will help you quickly identify the best fit by comparing libraries on performance, customization, and developer experience, so you can confidently select the solution that enhances your app’s user experience.

1. Syncfusion Angular Charts
Syncfusion® Angular Charts is a comprehensive and high-performance charting library. It is designed to help Angular developers transform complex data into clear, interactive, and visually compelling insights. It provides 55+ chart and graph types, covering essential visualizations such as line, column, bar, and pie charts, along with advanced charting scenarios including financial, statistical, and scientific data representations.
The library is built with performance and scalability in mind, enabling smooth rendering and interaction even with large datasets. To support effective data exploration, Syncfusion Angular Charts component includes built-in interactive features such as zooming, panning, tooltips, crosshair, trackball, highlighting, and selection. These interactions work seamlessly out of the box, enabling developers to deliver rich analytical experiences without requiring additional logic.
To integrate the Charts component into your Angular application, follow these steps:
- Install the ej2-angular-charts component via npm:
npm install @syncfusion/ej2-angular-charts --save
- Import the ChartAllModule from the library in your app.module.ts file or import the Angular standalone component directly into the file.
import { ChartAllModule } from '@syncfusion/ej2-angular-charts';
Ready to maximize the power of Syncfusion Angular Charts? Explore our documentation for step-by-step guidance and check out code examples to see key features in action.
Key benefits
Extensive Chart collection
Syncfusion offers over 55 chart types, including:
- Basic charts: Bar, Line, Pie, Spline, Step line and Area.
- Advanced charts: Pareto, Waterfall, Polar, Spline Area and Range.
- Specialized charts: Box and Whisker, Pyramid, Bubble, Funnel, Histogram and Scatter.
High performance for large datasets
Syncfusion Charts are optimized for handling large datasets with canvas rendering and virtualization, ensuring smooth performance even with millions of data points.
Rich interactivity and responsiveness
- Features include zooming and panning, drill-downs, crosshairs, and tooltips.
- Live updates and drag-and-drop functionality enhance dynamic visualizations, providing a seamless user experience.
Customization and theming
- Customize every aspect of charts, from colors to fonts.
- Choose from light and dark themes for seamless integration with your app.
Mobile-first and responsive design
Syncfusion Charts are touch-enabled and adapt to various screen sizes. These features make them ideal for mobile and cross-platform apps.
Export options
Charts can be exported to PNG, JPG, PDF, or SVG formats for sharing and reporting purposes.
Built-in accessibility
Syncfusion Angular Charts include accessibility and global usability features:
- Support for accessibility standards like WCAG 2.2, Section 508, and WAI-ARIA.
- Keyboard navigation for chart interactions.
- Screen readers support for assistive technologies.
- Right-to-left (RTL) layout support for global and multilingual apps.
Smooth animation
Syncfusion Angular Charts include built-in animations that make changes in data easier to notice:
- Smooth series animations are enabled by default.
- Visual transitions when charts load or update.
- No configuration is required to get started.
These animations enable users to quickly identify trends and updates in dashboards and reports. With its exceptional performance, ability to handle large datasets, and wide range of chart types, Syncfusion is an outstanding choice. Plus, its flexible licensing model includes a free community license for small businesses and independent developers.
2. Highcharts
Highcharts is another option for Angular projects. Integrating Highcharts into your application is simple:
- Install the highcharts-angular component:
npm install highcharts-angular --save
- Import the HighchartsChartModule from the package in your app.module.ts.
Key benefits
- Responsive design: Automatically adjusts to various screen sizes.
- Interactivity: Includes features like tooltips, zooming, and real-time updates.
- Accessibility: Ensures charts are accessible to all users, including those with disabilities.
- Customizability: Easily style charts using JavaScript or CSS.
3. FusionCharts
FusionCharts is a versatile library that integrates seamlessly with Angular. To get started:
- Install the required libraries:
npm install fusioncharts angular-fusioncharts --save
- Import the FusionChartsModule in your app.module.ts.
Key benefits
- A wide range of chart types, from simple to advanced.
- Interactive features like tooltips, zooming, and drill-downs.
- Responsive design ensures charts look great on all screen sizes.
- Extensive customization options for matching your app’s branding.
4. ng2-Charts
ng2-Charts, a wrapper for Chart.js, provides a simple way to add dynamic charts to your Angular application. Installation of the libraries is straightforward:
npm install ng2-charts --save
npm install chart.js --save
Key benefits
- Seamless integration with Angular.
- Built on Chart.js, known for its robust features.
- Real-time updates and responsive designs.
- Customizable charts with minimal setup.
5. ngx-echarts
ngx-echarts, a wrapper for Apache ECharts, is perfect for applications requiring advanced and interactive visualizations. To set it up, install the libraries:
npm install echarts -S
npm install ngx-echarts -S
Key benefits
- Integration with Apache ECharts, offering rich and complex visualizations.
- Customizable chart styles and themes.
- A wide range of chart types, from bar and line to heatmap and tree charts.
- Features like zooming, tooltips, and dynamic updates.
- Responsive design for various screen sizes.
Quick comparison of popular Angular chart libraries
Every chart library brings something unique to the table. Use the comparison below to quickly see how they stack up.
| Library | Chart types | Performance | Interactivity |
| Syncfusion Charts | 55+ | Excellent | Advanced |
| Highcharts | 30+ | Good | Advanced |
| FusionCharts | 100+ | Good | Advanced |
| ng2-Charts | Basic | Good | Advanced |
| ngx-echarts | Advanced | Good | Advanced |
Conclusion
Thanks for reading! Choosing the right chart library isn’t just about looks; it’s about speed, flexibility, and scalability. Syncfusion offers a wide range of charts, excellent performance, and a free community license, while others, such as Highcharts and FusionCharts, have their own strengths. Think about what matters most for your project: speed, chart variety, or advanced interactivity, and pick the one that fits best.
Looking for charts beyond Angular? Syncfusion, has you covered with a full range of chart libraries for web, desktop, and mobile platforms.
| JavaScript Charts | Angular Charts | React Charts | Vue Charts |
| ASP.NET MVC Charts | ASP.NET Core Charts | Blazor Charts | .NET MAUI Charts |
| WPF Charts | WinUI Charts | WinForms Charts | Flutter Charts |
The new version of Essential Studio is available for existing customers on the license and downloads page. If you’re new, sign up for our 30-day free trial to explore our features.
Feel free to contact us through our support forum, support portal, or feedback portal. We’re always here to assist you!
 No spam, just valuable updates.