
TL;DR: Learn to build an AI-powered air quality monitoring dashboard with the WPF Spline Chart. It covers how AI enhances air quality tracking through real-time visuals, predictions, and trend analysis. Learn to fetch data using AI services, visualize it with interactive charts and maps, and display key metrics like the pollution index and 7-day average. The blog also explores customizing chart styles, adding panning, tooltips, and markers, and using input controls for user interaction.
Air pollution is a global concern, impacting public health and environmental sustainability. Monitoring air quality in real time and predicting future trends can help authorities and individuals make informed decisions.
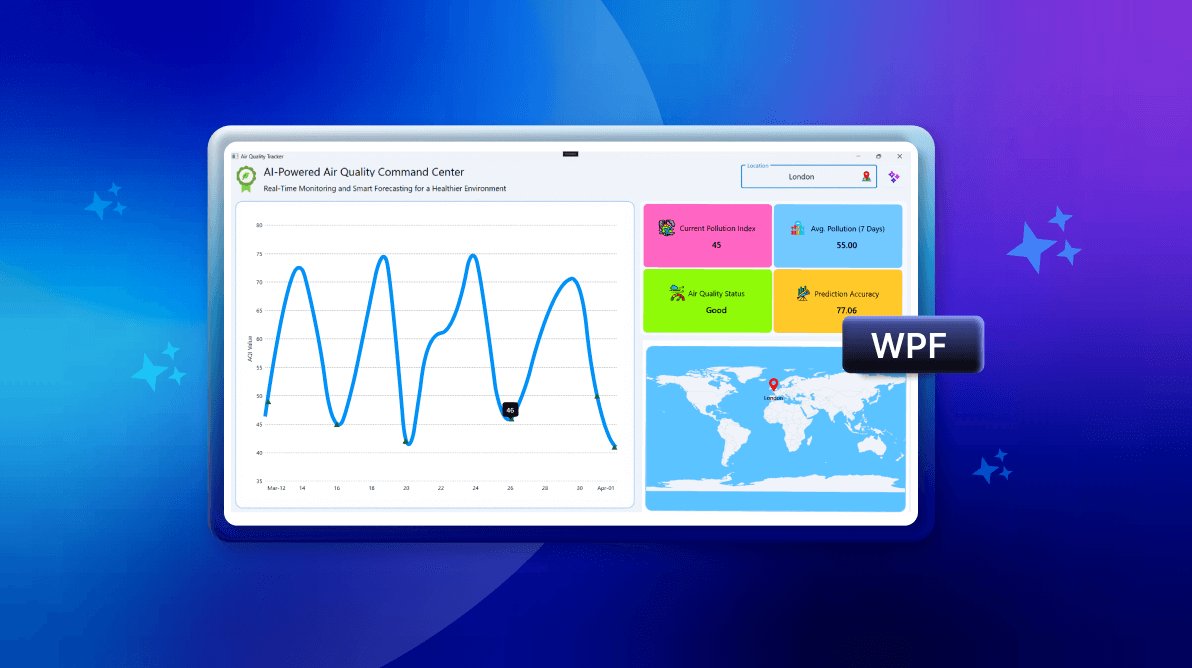
This week’s Chart of the Week highlights building an AI-powered air pollution monitoring dashboard using Syncfusion® WPF Spline Chart. This dashboard visualizes real-time pollution levels and leverages AI-driven forecasts to predict trends accurately.
Why use AI for air quality monitoring?
Traditional air quality monitoring depends on sensor networks and government reports, which may not always provide real-time insights. By integrating Azure OpenAI with our WPF Charts, our dashboard offers:
- Real-time air quality visualization for instant data updates.
- AI-driven pollution predictions to forecast air quality trends.
- Interactive charts to analyze historical air quality patterns.
- Seamless data integration with external sources for comprehensive monitoring.
How does it work?
- User input: Enter the country name using the text input layout.
- AI data retrieval: Fetch air quality data from the past month for the selected country using AI-powered services with the required credentials.
- Data extraction: Extract the JSON response from the AI-powered system.
- Visualization: Bind the retrieved data to dashboard controls such as charts and maps for real-time air quality monitoring.
- AI prediction: Use AI-driven predictive analytics to forecast air quality for the next month and display it in the dashboard.
Now, let’s walk you through the step-by-step process of building this AI-powered air quality monitoring dashboard.
Step 1: Populating the data using the AI service
We’ll use an AI-powered API to fetch air quality data for different countries, including historical pollution trends and future predictions.
First, define the AirQualityInfo model class, which holds properties for air quality details.
public class AirQualityInfo
{
    public DateTime Date { get; set; }
    public double PollutionIndex { get; set; }
    public string? AirQualityStatus { get; set; }
    public double Latitude { get; set; }
    public double Longitude { get; set; }
    public double AIPredictionAccuracy { get; set; }
}
Next, implement the AIAirQualityService class, which is the core of this dashboard. This class handles credential validation, prompt generation, and AI-based prediction responses.
Refer to the following code example.
public class AIAirQualityService
{
    #region Properties

    internal const string Endpoint = "YOUR_END_POINT_NAME";
    internal const string DeploymentName = "DEPLOYMENT_NAME";
    internal const string Key = "API_KEY";

    internal IChatClient? Client { get; set; }
    internal bool IsValid { get; set; }

    #endregion

    #region Constructor

    public AIAirQualityService ()
    {
        _ = ValidateCredential();
    }

    #endregion

    #region Methods

    internal async Task ValidateCredential()
    {
        GetAzureOpenAIClient();

        try
        {
            if (Client != null)
            {
                IsValid = true;
                await Client!.CompleteAsync("Hello, AI Validation");
            }
            else
            {
                IsValid = false;
            }
        }
        catch (Exception)
        {
            IsValid = false;
        }
    }

    internal async Task<List<AirQualityInfo>> PredictAirQualityTrends(string location)
    {
        try
        {
            string today = DateTime.UtcNow.ToString("yyyy-MM-dd");
            string startDate = DateTime.UtcNow.AddDays(-30).ToString("yyyy-MM-dd");

            var systemMessage = "You are an AI model specialized in air pollution forecasting and environmental analysis. " +
                                "Your task is to generate a realistic dataset for the past 30 days (" + startDate + " to " + today + ") " +
                                "for the specified location. The data should include daily air quality trends.";

            var userMessage = $"Generate a JSON-formatted dataset for the past 30 days for {location}. " +
                              "Ensure that the output follows this structured format:\n\n" +
                              "[\n" +
                              "  {\n" +
                              "    \"Date\": \"YYYY-MM-DD\",\n" +
                              "    \"PollutionIndex\": \"Air Quality Index (0-500)\",\n" +
                              "    \"AirQualityStatus\": \"Good | Satisfactory | Moderate | Poor | Very Poor | Severe \",\n" +
                              "    \"Latitude\": \"decimal\",\n" +
                              "    \"Longitude\": \"decimal\"\n" +
                              "    \"AIPredictionAccuracy\": \"Confidence score (0-85)\"\n" +
                              "  }\n" +
                              "]\n\n" +
                              "The generated data should be realistic and reflect environmental patterns.";

            string response = await GetAnswerFromGPT(systemMessage + "\n\n" + userMessage);
            string extractedJson = JsonExtractor.ExtractJson(response);

            return !string.IsNullOrEmpty(extractedJson)
                ? JsonSerializer.Deserialize<List<AirQualityInfo>>(extractedJson) ?? new List<AirQualityInfo>()
                : new List<AirQualityInfo>();
        }
        catch (Exception)
        {
            MessageBox.Show("Invalid Credential , The data has been retrieved from the previously loaded JSON file.");
            return GetCurrentDataFromEmbeddedJson();
        }
    }

    internal async Task<List<AirQualityInfo>> PredictNextMonthForecast(List<AirQualityInfo> historicalData)
    {
        try
        {
            string today = DateTime.UtcNow.ToString("yyyy-MM-dd");
            string futureDate = DateTime.UtcNow.AddDays(30).ToString("yyyy-MM-dd");

            var systemMessage = "You are an AI model specialized in air pollution forecasting. " +
                                "Based on the provided historical data, generate an accurate prediction " +
                                "for air quality trends over the next 30 days (" + today + " to " + futureDate + ").";

            var userMessage = $"Using the following historical dataset, predict the Pollution Index for the next 30 days:\n\n" +
                              $"{JsonSerializer.Serialize(historicalData)}\n\n" +
                              "Ensure the output follows this structured format:\n\n" +
                              "[\n" +
                              "  {\n" +
                              "    \"Date\": \"YYYY-MM-DD\",\n" +
                              "    \"PollutionIndex\": \"Air Quality Index (0-500)\"\n" +
                              "  }\n" +
                              "]\n\n" +
                              "Ensure that predictions are realistic and follow previous trends.";

            string response = await GetAnswerFromGPT(systemMessage + "\n\n" + userMessage);
            string extractedJson = JsonExtractor.ExtractJson(response);

            return !string.IsNullOrEmpty(extractedJson)
                ? JsonSerializer.Deserialize<List<AirQualityInfo>>(extractedJson) ?? new List<AirQualityInfo>()
                : new List<AirQualityInfo>();
        }
        catch (Exception)
        {
            MessageBox.Show("Invalid Credential , The data has been retrieved from the previously loaded JSON file.");
            return GetPredictionFromEmbeddedJson();
        }
    }

    private void GetAzureOpenAIClient()
    {
        try
        {
            var client = new AzureOpenAIClient(new Uri(Endpoint), new AzureKeyCredential(Key)).AsChatClient(modelId: DeploymentName);
            this.Client = client;
        }
        catch (Exception)
        {
        }
    }

    private async Task<string> GetAnswerFromGPT(string userPrompt)
    {
        try
        {
            if (Client != null)
            {
                var response = await Client.CompleteAsync(userPrompt);
                return response.ToString();
            }
        }
        catch
        {
            return "";
        }

        return "";
    }

    private List<AirQualityInfo> GetCurrentDataFromEmbeddedJson()
    {
        var executingAssembly = typeof(App).GetTypeInfo().Assembly;

        using (var stream = executingAssembly.GetManifestResourceStream("AirQualityTracker.Resources.current_data.json"))
        {
            if (stream == null)
            {
                // Log or handle the missing resource scenario
                return new List<AirQualityInfo>();
            }

            using (var textStream = new StreamReader(stream))
            {
                string json = textStream.ReadToEnd();
                return JsonSerializer.Deserialize<List<AirQualityInfo>>(json) ?? new List<AirQualityInfo>();
            }
        }
    }

    private List<AirQualityInfo> GetPredictionFromEmbeddedJson()
    {
        var executingAssembly = typeof(App).GetTypeInfo().Assembly;

        using (var stream = executingAssembly.GetManifestResourceStream("AirQualityTracker.Resources.prediction_data.json"))
        {
            if (stream == null)
            {
                // Log or handle the missing resource scenario
                return new List<AirQualityInfo>();
            }

            using (var textStream = new StreamReader(stream))
            {
                string json = textStream.ReadToEnd();
                return JsonSerializer.Deserialize<List<AirQualityInfo>>(json) ?? new List<AirQualityInfo>();
            }
        }
    }


    #endregion
}
Finally, create the AirQualityViewModel class to store the retrieved data and serve as the binding context for the dashboard.
Refer to the following code example.
public class AirQualityViewModel : INotifyPropertyChanged
{
    #region Fields

    private AIAirQualityService? airQualityService;
    private string countryName = "New York";
    private bool isEnabled;
    private bool isBusy;
    private ObservableCollection<AirQualityInfo>? data;
    private ObservableCollection<AirQualityInfo>? foreCastData;
    private ObservableCollection<AirQualityInfo>? mapMarkers;
    private string currentPollutionIndex = "Loading...";
    private string avgPollution7Days = "Loading...";
    private string aiPredictionAccuracy = "Loading...";
    private string latestAirQualityStatus = "Loading...";

    #endregion

    #region Properties

    public string CountryName
    {
        get => countryName;
        set
        {
            countryName = value;
            OnPropertyChanged(nameof(CountryName));
        }
    }

    public bool IsBusy
    {
        get
        {
            return isBusy;
        }

        set
        {
            isBusy = value;
            OnPropertyChanged(nameof(IsBusy));
        }
    }

    public bool IsEnabled
    {
        get
        {
            return isEnabled;
        }

        set
        {
            isEnabled = value;
            OnPropertyChanged(nameof(IsEnabled));
        }
    }

    public ObservableCollection<AirQualityInfo>? Data
    {
        get => data;
        set
        {
            data = value;
            OnPropertyChanged(nameof(Data));
        }
    }

    public ObservableCollection<AirQualityInfo>? ForeCastData
    {
        get => foreCastData;
        set
        {
            foreCastData = value;
            OnPropertyChanged(nameof(ForeCastData));
        }
    }

    public ObservableCollection<AirQualityInfo>? MapMarkers
    {
        get => mapMarkers;
        set
        {
            mapMarkers = value;
            OnPropertyChanged(nameof(MapMarkers));
        }
    }

    public string CurrentPollutionIndex
    {
        get => currentPollutionIndex;
        set
        {
            if (currentPollutionIndex != value)
            {
                currentPollutionIndex = value;
                OnPropertyChanged(nameof(CurrentPollutionIndex));
            }
        }
    }

    public string AvgPollution7Days
    {
        get => avgPollution7Days;
        set
        {
            if (avgPollution7Days != value)
            {
                avgPollution7Days = value;
                OnPropertyChanged(nameof(AvgPollution7Days));
            }
        }
    }

    public string AIPredictionAccuracy
    {
        get => aiPredictionAccuracy;
        set
        {
            if (aiPredictionAccuracy != value)
            {
                aiPredictionAccuracy = value;
                OnPropertyChanged(nameof(AIPredictionAccuracy));
            }
        }
    }

    public string LatestAirQualityStatus
    {
        get => latestAirQualityStatus;
        set
        {
            if (latestAirQualityStatus != value)
            {
                latestAirQualityStatus = value;
                OnPropertyChanged(nameof(LatestAirQualityStatus));
            }
        }
    }


    #endregion

    #region Constructor

    public AirQualityViewModel()
    {
        IsBusy = true;
        IsEnabled = true;
    }

    #endregion

    #region Methods

    internal async Task FetchAirQualityData(string countryName)
    {
        airQualityService = new AIAirQualityService ();

        IsBusy = true;

        var newData = await airQualityService.PredictAirQualityTrends(countryName);
        Data = new ObservableCollection<AirQualityInfo>(newData);

        var singleMarker = Data.Select(d => new AirQualityInfo
        {
            Latitude = d.Latitude,
            Longitude = d.Longitude
        }).FirstOrDefault();

        if (singleMarker != null)
         MapMarkers = new ObservableCollection<AirQualityInfo> { singleMarker };

        CountryName = countryName;
        UpdateCalculatedProperties();
        IsBusy = false;
    }

    internal async Task PredictForecastData()
    {
        IsBusy = true;

        var historicalData = Data?.OrderByDescending(d => d.Date).Take(40)
            .Select(d => new AirQualityInfo
            {
                Date = d.Date,
                PollutionIndex = d.PollutionIndex
            })
            .ToList();

        if (airQualityService != null && historicalData != null)
        {
            var forecastedData = await airQualityService.PredictNextMonthForecast(historicalData);

            ForeCastData = new ObservableCollection<AirQualityInfo>(forecastedData);
        }

        IsBusy = false;
    }

    internal async Task ValidateCredential()
    {
        if(airQualityService != null)
        {
            await airQualityService.ValidateCredential();

            if (!airQualityService.IsValid)
            {
                IsEnabled = false;
                CountryName = "New York";
            }
            else
            {
                IsEnabled = true;
            }
        }
    }

    private void UpdateCalculatedProperties()
    {
        if (!IsBusy)
            return;

        var latestData = Data?.OrderByDescending(d => d.Date).FirstOrDefault();
        CurrentPollutionIndex = latestData != null ? latestData.PollutionIndex.ToString("F0") : "0";

        var last7Days = Data?.OrderByDescending(d => d.Date).Take(7).ToList();
        AvgPollution7Days = (last7Days != null && last7Days.Any())
            ? last7Days.Average(d => d.PollutionIndex).ToString("F2")
            : "0.00";

        AIPredictionAccuracy = (Data != null && Data.Any())
            ? Data.Average(d => d.AIPredictionAccuracy).ToString("F2")
            : "0.00";

        LatestAirQualityStatus = latestData?.AirQualityStatus ?? "Unknown";
    }

    #endregion

    #region Property Changed Event

    public event PropertyChangedEventHandler? PropertyChanged;
    protected void OnPropertyChanged([CallerMemberName] string propertyName = "")
    {
        PropertyChanged?.Invoke(this, new PropertyChangedEventArgs(propertyName));
    }

    #endregion
}
Step 2: Configuring the WPF Text Input Layout and Button controls
The WPF Text Input Layout is used to enter the location to retrieve air quality data, while the Button triggers the API call to fetch the forecasted air quality details.
This setup ensures a seamless user experience by providing clear input validation and enabling dynamic data retrieval based on the selected location.
Refer to the following code example.
<Grid Grid.Row="0" Grid.ColumnSpan="2">
    <Grid.ColumnDefinitions>
        <ColumnDefinition Width="4.5*" />
        <ColumnDefinition Width="3*" />
        <ColumnDefinition Width="2*" />
        <ColumnDefinition Width="0.5*" />
    </Grid.ColumnDefinitions>

    <Grid Grid.Column="0">
        <Grid.ColumnDefinitions>
            <ColumnDefinition Width="1*" />
            <ColumnDefinition Width="9*" />
        </Grid.ColumnDefinitions>

        <Grid.RowDefinitions>
            <RowDefinition Height="*" />
            <RowDefinition Height="*" />
        </Grid.RowDefinitions>

        <Image Grid.RowSpan="2" Grid.Column="0" Source="/Images/leaf.png" Height="60" Width="60" />
        <Label Grid.Row="0" Grid.Column="1" Content="AI-Powered Air Quality Command Center" FontSize="25" VerticalAlignment="Center" />
        <Label Grid.Row="1" Grid.Column="1" Content="Real-Time Monitoring and Smart Forecasting for a Healthier Environment"
               FontSize="17" VerticalAlignment="Center" />
    </Grid>

    <inputLayout:SfTextInputLayout Grid.Column="2" Hint="Location" ContainerType="Outlined" IsEnabled="{Binding IsEnabled}"
                                   FontSize="17" VerticalContentAlignment="Center">
        <TextBox x:Name="countryTextBox" Text="{Binding CountryName}" KeyDown="TextBox_KeyDown" TextWrapping="Wrap"
                 HorizontalContentAlignment="Center" />

        <inputLayout:SfTextInputLayout.TrailingView>
            <Image Source="/Images/map.png" />
        </inputLayout:SfTextInputLayout.TrailingView>
    </inputLayout:SfTextInputLayout>

    <syncfusion:ButtonAdv Grid.Column="3" x:Name="predictionButton" SizeMode="Small" Content="" SmallIcon="Images\ai.png"
                          Background="Transparent" BorderBrush="Transparent" Margin="10,10,10,20" IconWidth="30" IconHeight="30"
                          Click="ForecastButton_Click" />
</Grid>
The following code example demonstrates retrieving data by entering a country name and forecasting the values with a button click.
public partial class MainWindow : Window
{
    public MainWindow()
    {
        InitializeComponent();
    }

    private async void TextBox_KeyDown(object sender, KeyEventArgs e)
    {
        if (e.Key == Key.Enter)
        {
            _ = viewModel.ValidateCredential();

            predictionButton.Background = Brushes.Transparent;
            busyIndicator.AnimationType = Syncfusion.Windows.Controls.Notification.AnimationTypes.Flower;

            string countryName = countryTextBox.Text.Trim();

            if (!string.IsNullOrEmpty(countryName))
            {
                viewModel.IsBusy = true; // Set busy state before clearing data

                viewModel.Data?.Clear();
                viewModel.ForeCastData?.Clear();
                viewModel.MapMarkers?.Clear();

                viewModel.CurrentPollutionIndex = viewModel.AIPredictionAccuracy =
                    viewModel.AvgPollution7Days = viewModel.LatestAirQualityStatus = "Loading...";

                await viewModel.FetchAirQualityData(countryName);

                viewModel.IsBusy = false; // Reset after fetching
            }
        }
    }

    private void ForecastButton_Click(object sender, RoutedEventArgs e)
    {
        ApplyAIButtonStyle();
        busyIndicator.AnimationType = Syncfusion.Windows.Controls.Notification.AnimationTypes.Rectangle;
        viewModel?.PredictForecastData();
    }

    private void ApplyAIButtonStyle()
    {
        LinearGradientBrush gradient = new LinearGradientBrush();
        gradient.StartPoint = new Point(0, 0);
        gradient.EndPoint = new Point(1, 1);
        gradient.GradientStops.Add(new GradientStop((Color)ColorConverter.ConvertFromString("#99D0ED"), 0));
        gradient.GradientStops.Add(new GradientStop((Color)ColorConverter.ConvertFromString("#C2E4F6"), 1));
        predictionButton.Background = gradient;
    }
}
Refer to the following image.

Step 3: Configuring the WPF Charts
Let’s configure the WPF Charts control and then bind the air pollution data from the AI service to the Spline series.
<Border Grid.Row="1" Grid.RowSpan="2" Grid.Column="0" BorderBrush="#91B9FB"
        BorderThickness="1.5" Background="#FFFEFF" Margin="10" CornerRadius="15">

    <chart:SfChart Margin="5,10,10,10">

        <chart:SfChart.PrimaryAxis>
            <chart:DateTimeAxis>
            </chart:DateTimeAxis>
        </chart:SfChart.PrimaryAxis>

        <chart:SfChart.SecondaryAxis>
            <chart:NumericalAxis>
            </chart:NumericalAxis>
        </chart:SfChart.SecondaryAxis>

        <chart:SplineSeries ItemsSource="{Binding Data}"
                            XBindingPath="Date"
                            YBindingPath="PollutionIndex"/>

        <chart:SplineSeries ItemsSource="{Binding ForeCastData}"
                            XBindingPath="Date"
                            YBindingPath="PollutionIndex"/>

    </chart:SfChart>

</Border>
Refer to the following image.
Step 4: Customizing the chart appearance
Let’s enhance the WPF Spline Chart by customizing its axis, series color, and interactive behavior for a more intuitive and visually appealing experience.
Customize the chart axis
We can modify the chart axis using the following properties:
- ShowGridLines: Controls the visibility of major grid lines.
- TickLineSize: Adjusts the tick size along the axis.
- HeaderTemplate: Customizes the axis title label.
- AxisLineStyle: Defines the axis line style.
- MajorGridLineStyle: Modifies the appearance of major grid lines.
<chart:SfChart.PrimaryAxis>
    <chart:DateTimeAxis AutoScrollingDelta="20"
                        FontSize="13"
                        IntervalType="Days"
                        AutoScrollingDeltaType="Days"
                        AutoScrollingMode="End"
                        LabelCreated="DateTimeAxis_LabelCreated"
                        ShowGridLines="False"
                        TickLineSize="0"
                        PlotOffset="5"
                        EdgeLabelsDrawingMode="Shift">

        <chart:DateTimeAxis.AxisLineStyle>
            <Style TargetType="Line">
                <Setter Property="StrokeThickness" Value="0"/>
            </Style>
        </chart:DateTimeAxis.AxisLineStyle>

    </chart:DateTimeAxis>
</chart:SfChart.PrimaryAxis>

<chart:SfChart.SecondaryAxis>
    <chart:NumericalAxis PlotOffsetEnd="20"
                         FontSize="13"
                         TickLineSize="0">

        <chart:NumericalAxis.HeaderTemplate>
            <DataTemplate>
                <TextBlock Text="AQI Value" Padding="0,0,0,5" FontSize="14"/>
            </DataTemplate>
        </chart:NumericalAxis.HeaderTemplate>

        <chart:NumericalAxis.MajorGridLineStyle>
            <Style TargetType="Line">
                <Setter Property="StrokeThickness" Value="1"/>
                <Setter Property="Stroke" Value="Gray"/>
                <Setter Property="StrokeDashArray" Value="2,2"/>
            </Style>
        </chart:NumericalAxis.MajorGridLineStyle>

        <chart:NumericalAxis.AxisLineStyle>
            <Style TargetType="Line">
                <Setter Property="StrokeThickness" Value="0"/>
            </Style>
        </chart:NumericalAxis.AxisLineStyle>

    </chart:NumericalAxis>
</chart:SfChart.SecondaryAxis>
Customize the chart color
The chart’s series thickness and color can be customized using the StrokeThickness and Interior properties.
<chart:SplineSeries StrokeThickness="2" Interior="#008FFB"/>

<chart:SplineSeries StrokeThickness="2.5"
                     Interior="#2BD26E"
                     StrokeDashArray="2,2,6,2,2,6"/>
Incorporating panning and tooltips
To enhance the chart’s readability, we can add tooltips to display detailed data and panning to scroll within a specific range. These features can be configured using ShowTooltip, ChartZoomPanBehavior, and AutoScrollingDelta properties.
<chart:SfChart>

    <chart:SfChart.PrimaryAxis>
        <chart:DateTimeAxis AutoScrollingDelta="20"
                            AutoScrollingDeltaType="Days"
                            AutoScrollingMode="End"/>
    </chart:SfChart.PrimaryAxis>

    <chart:SfChart.SecondaryAxis>
        <chart:NumericalAxis/>
    </chart:SfChart.SecondaryAxis>

    <chart:SfChart.Behaviors>
        <chart:ChartZoomPanBehavior EnableMouseWheelZooming="False"
                                     EnablePinchZooming="False"
                                     ResetOnDoubleTap="False"
                                     EnablePanning="True"/>
    </chart:SfChart.Behaviors>

    <chart:SplineSeries ShowTooltip="True"/>

</chart:SfChart>
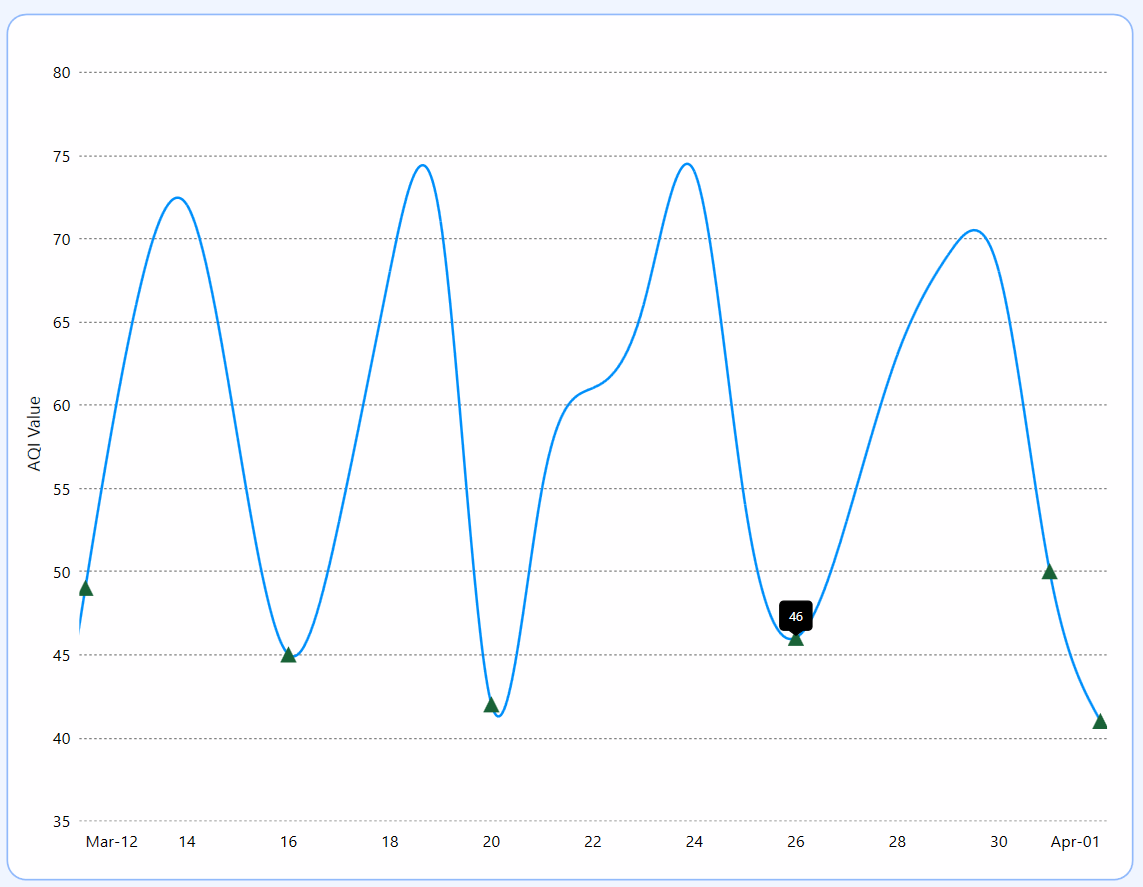
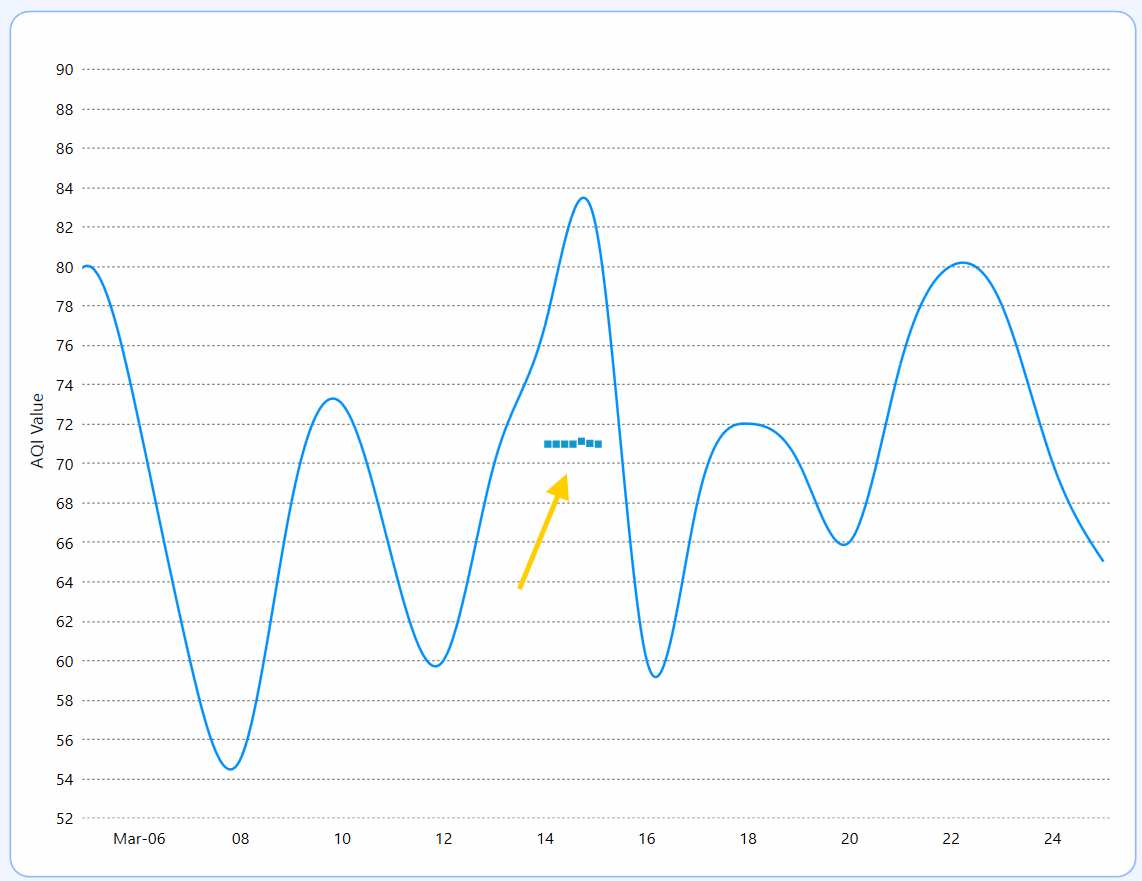
Adding markers
Markers highlight significant data points on the chart, aiding in analysis and interpretation. In this case, a custom marker is used to represent good air quality index values, which is achieved through a custom converter.
XAML
<chart:SplineSeries>

    <chart:SplineSeries.AdornmentsInfo>
        <chart:ChartAdornmentInfo ShowMarker="True">
            <chart:ChartAdornmentInfo.SymbolTemplate>
                <DataTemplate>
                    <Path Data="M 6.5,0 L 13,13 L 0,13 Z"
                          Fill="#196237"
                          Visibility="{Binding Converter={StaticResource visibilityConverter}}"/>
                </DataTemplate>
            </chart:ChartAdornmentInfo.SymbolTemplate>
        </chart:ChartAdornmentInfo>
    </chart:SplineSeries.AdornmentsInfo>

</chart:SplineSeries>
C#
public class AQIToVisibilityConverter : IValueConverter
{
    public object Convert(object value, Type targetType, object parameter, CultureInfo culture)
    {
        if (value is ChartAdornment adornment && adornment.Item is AirQualityInfo airQualityInfo)
        {
            return airQualityInfo.PollutionIndex <= 50 ? Visibility.Visible : Visibility.Hidden;
        }

        return Visibility.Hidden;
    }

    public object ConvertBack(object value, Type targetType, object parameter, CultureInfo culture)
    {
        throw new NotImplementedException();
    }
}
Refer to the following image.
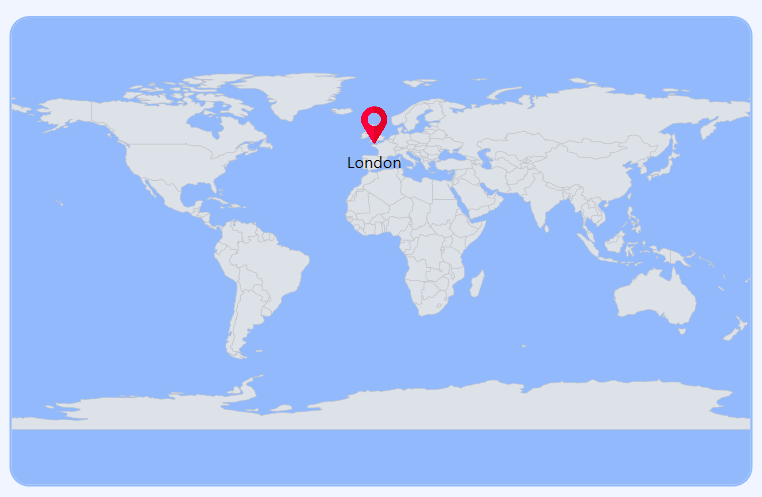
Step 5: Adding the WPF Maps for location visualization
The WPF Maps is used to display the selected country’s air pollution data geographically, making it easier to identify pollution hotspots.
<Border Grid.Row="2" Grid.Column="1" Background="#91b9fb" BorderBrush="#91B9FB" BorderThickness="1.5" Margin="10" CornerRadius="15">
    <map:SfMap EnableZoom="False" ZoomFactor="2">
        <map:SfMap.Layers>
            <map:ShapeFileLayer Uri="AirQualityTracker.Resources.world.shp" Markers="{Binding MapMarkers}">
                <map:ShapeFileLayer.MarkerTemplate>
                    <DataTemplate>
                        <Grid>
                            <StackPanel Orientation="Vertical">
                                <Image Source="/Images/map_pin.png" Height="30" Width="30"/>
                                <TextBlock HorizontalAlignment="Center" Margin="0,5,0,0" FontSize="13"
                                           Text="{Binding CountryName, Source={x:Reference viewModel}}"/>
                            </StackPanel>
                        </Grid>
                    </DataTemplate>
                </map:ShapeFileLayer.MarkerTemplate>
            </map:ShapeFileLayer>
        </map:SfMap.Layers>
    </map:SfMap>
</Border>
Refer to the following image.
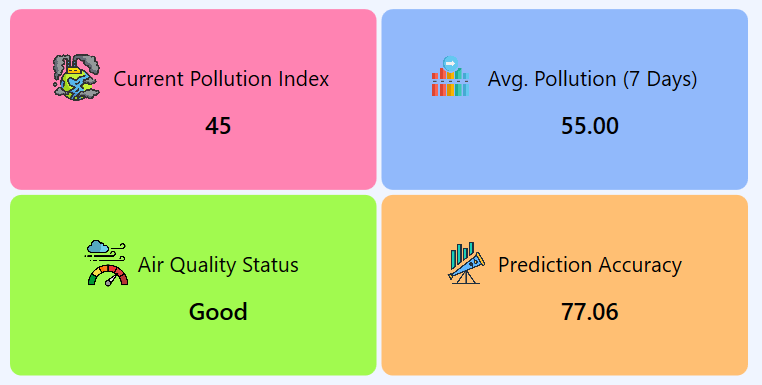
Step 6: Arranging air quality data content
Let’s display the AI-generated data in a structured and readable format, highlighting key air quality insights. The dashboard presents:
- Current pollution index: Displays the real-time pollution level.
- Avg. pollution (7 Days): Shows the average pollution level over the past week.
- Air quality status: Indicates the overall air quality condition.
- Prediction accuracy: Shows the AI model’s confidence in forecasting air quality trends.
This layout ensures quick and easy interpretation of air quality metrics.
<Grid Grid.Row="1" Grid.Column="1" Margin="10">

    <Grid.ColumnDefinitions>
        <ColumnDefinition Width="*"/>
        <ColumnDefinition Width="*"/>
    </Grid.ColumnDefinitions>

    <Grid.RowDefinitions>
        <RowDefinition Height="*"/>
        <RowDefinition Height="*"/>
    </Grid.RowDefinitions>

    <Border Grid.Row="0" Grid.Column="0" Background="#FF83B2" BorderThickness="2" CornerRadius="10">
        <Grid HorizontalAlignment="Center" VerticalAlignment="Center">

            <Grid.RowDefinitions>
                <RowDefinition Height="*"/>
                <RowDefinition Height="*"/>
            </Grid.RowDefinitions>

            <Grid.ColumnDefinitions>
                <ColumnDefinition Width="3*"/>
                <ColumnDefinition Width="7*"/>
            </Grid.ColumnDefinitions>

            <Image Grid.Row="0" Grid.Column="0" Source="/Images/pollution.png" Width="40" Height="40" />
            <Label Grid.Row="0" Grid.Column="1" Content=" Current Pollution Index" FontSize="17" VerticalAlignment="Center" />
            <Label Grid.Row="1" Grid.Column="1" Content="{Binding CurrentPollutionIndex}" FontSize="19" FontWeight="SemiBold" HorizontalContentAlignment="Center" />
        </Grid>
    </Border>

    <Border Grid.Row="0" Grid.Column="1" Background="#91B9FB" BorderThickness="2" CornerRadius="10">
        <Grid HorizontalAlignment="Center" VerticalAlignment="Center">

            <Grid.RowDefinitions>
                <RowDefinition Height="*"/>
                <RowDefinition Height="*"/>
            </Grid.RowDefinitions>

            <Grid.ColumnDefinitions>
                <ColumnDefinition Width="3*"/>
                <ColumnDefinition Width="7*"/>
            </Grid.ColumnDefinitions>

            <Image Grid.Row="0" Grid.Column="0" Source="/Images/average.png" Width="40" Height="40" />
            <Label Grid.Row="0" Grid.Column="1" Content=" Avg. Pollution (7 Days)" FontSize="17" VerticalAlignment="Center" />
            <Label Grid.Row="1" Grid.Column="1" Content="{Binding AvgPollution7Days}" FontSize="19" FontWeight="SemiBold" HorizontalContentAlignment="Center" />
        </Grid>
    </Border>

    <Border Grid.Row="1" Grid.Column="0" Background="#A1FA4F" BorderThickness="2" CornerRadius="10">
        <Grid HorizontalAlignment="Center" VerticalAlignment="Center">
            <Grid.RowDefinitions>
                <RowDefinition Height="*"/>
                <RowDefinition Height="*"/>
            </Grid.RowDefinitions>
            <Grid.ColumnDefinitions>
                <ColumnDefinition Width="3*"/>
                <ColumnDefinition Width="7*"/>
            </Grid.ColumnDefinitions>

            <Image Grid.Row="0" Grid.Column="0" Source="/Images/air_quality.png" Width="40" Height="40" />
            <Label Grid.Row="0" Grid.Column="1" Content="Air Quality Status" FontSize="17" VerticalAlignment="Center" />
            <Label Grid.Row="1" Grid.Column="1" Content="{Binding LatestAirQualityStatus}" FontSize="19" FontWeight="SemiBold" HorizontalContentAlignment="Center" />
        </Grid>
    </Border>

    <Border Grid.Row="1" Grid.Column="1" Background="#FFBF73" BorderThickness="2" CornerRadius="10">
        <Grid HorizontalAlignment="Center" VerticalAlignment="Center">

            <Grid.RowDefinitions>
                <RowDefinition Height="*"/>
                <RowDefinition Height="*"/>
            </Grid.RowDefinitions>

            <Grid.ColumnDefinitions>
                <ColumnDefinition Width="3*"/>
                <ColumnDefinition Width="7*"/>
            </Grid.ColumnDefinitions>

            <Image Grid.Row="0" Grid.Column="0" Source="/Images/forecast.png" Width="40" Height="40" />
            <Label Grid.Row="0" Grid.Column="1" Content="Prediction Accuracy" FontSize="17" VerticalAlignment="Center" />
            <Label Grid.Row="1" Grid.Column="1" Content="{Binding AIPredictionAccuracy}" FontSize="19" FontWeight="SemiBold" HorizontalContentAlignment="Center" />
        </Grid>
    </Border>

</Grid>
Refer to the following image.
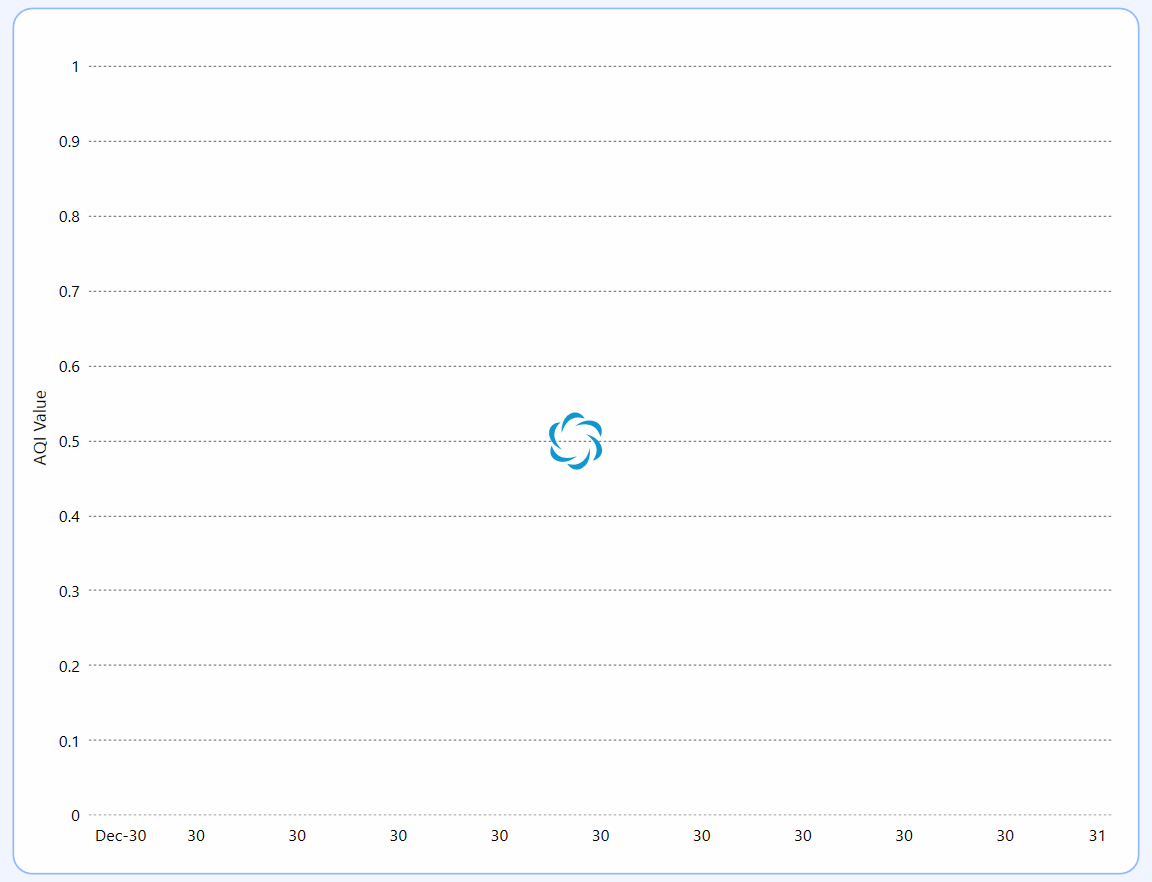
Step 7: Adding the WPF Busy Indicator for better visualization
Let’s add the WPF Busy Indicator to enhance the user experience while fetching data, ensuring smooth and responsive UI interactions.
<Notification:SfBusyIndicator Grid.Row="1" Grid.RowSpan="2" Grid.Column="0"
    x:Name="busyIndicator" HorizontalAlignment="Center" VerticalAlignment="Center"
    IsBusy="{Binding IsBusy}" AnimationType="Flower" Background="Transparent"/>
Refer to the following images.
To create an intuitive layout for the Air Quality Index dashboard, we arrange various elements such as text input fields, buttons, charts, and maps, within a Grid layout. This approach ensures a flexible and responsive design that adapts seamlessly to different screen sizes and orientations.
Refer to the following code example.
<Grid Background="#F0F5FF">

    <Grid.RowDefinitions>
        <RowDefinition Height="*"/>
        <RowDefinition Height="4*"/>
        <RowDefinition Height="5*"/>
    </Grid.RowDefinitions>

    <Grid.ColumnDefinitions>
        <ColumnDefinition Width="6*"/>
        <ColumnDefinition Width="4*"/>
    </Grid.ColumnDefinitions>

    <Grid Grid.Row="0" Grid.ColumnSpan="2">
        <!--Header view, text input layout, and forecast button-->
    </Grid>

    <Border Grid.Row="1" Grid.RowSpan="2" Grid.Column="0" BorderBrush="#91B9FB" BorderThickness="1.5" Background="#FFFEFF" Margin="10" CornerRadius="15">
        <!--Chart-->
    </Border>

    <Border Grid.Row="2" Grid.Column="1" Background="#91b9fb" BorderBrush="#91B9FB" BorderThickness="1.5" Margin="10" CornerRadius="15">
        <!--Map-->
    </Border>

    <Grid Grid.Row="1" Grid.Column="1" Margin="10">
        <!--Air quality data content-->
    </Grid>

</Grid>
Refer to the following image.
GitHub reference
For more details, refer to the AI-powered air quality monitoring dashboard using the WPF Spline Chart GitHub demo.
Conclusion
Thanks for reading! This blog explored how to build an AI-powered air pollution monitoring dashboard using the Syncfusion® WPF Spline Chart. Follow the outlined steps and share your feedback in the comments.
For any assistance, feel free to reach out through our support forum, support portal, or feedback portal—we’re happy to help you!


 No spam, just valuable updates.