
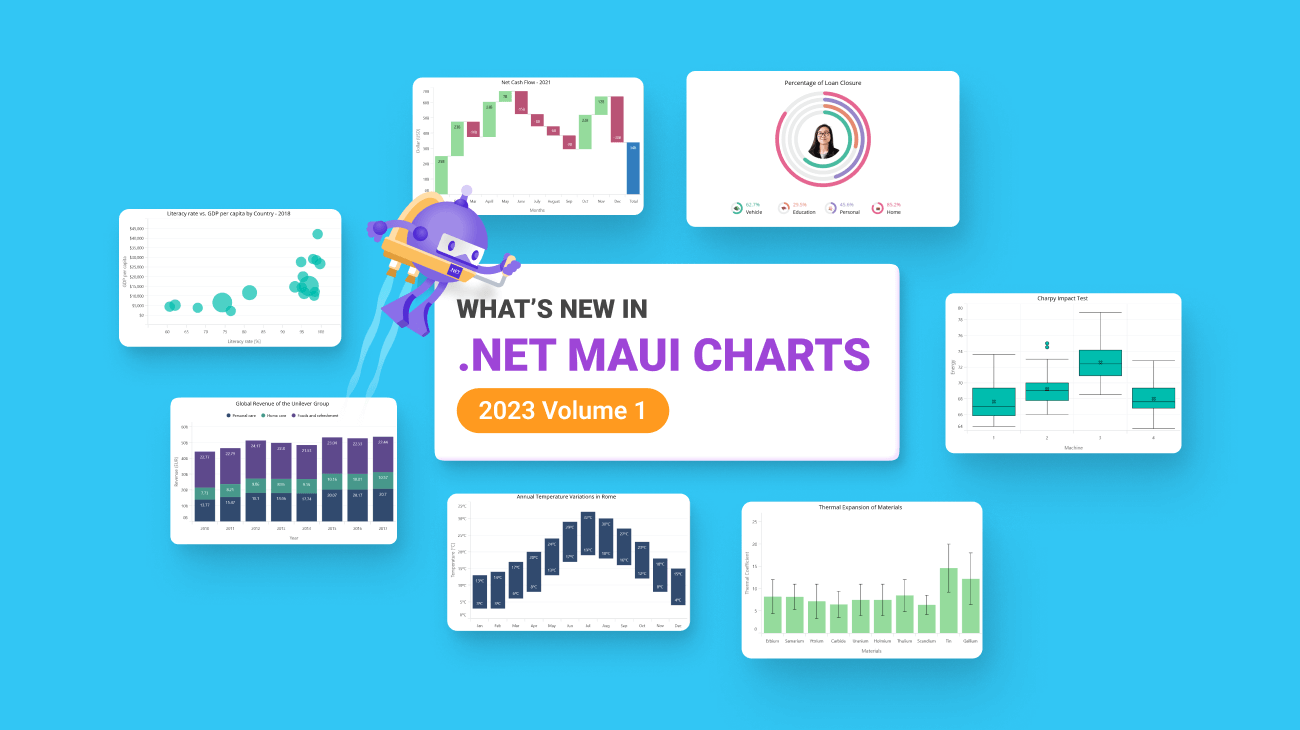
Syncfusion’s .NET MAUI Charts are well-crafted charting controls for visualizing data. They contain a rich gallery of charts and graphs that cater to all charting scenarios.
In this blog, I’ll quickly introduce the new features and chart types included in the Essential Studio® 2023 Volume 1 release.
New chart types in Cartesian Charts
There are six new chart types in the .NET MAUI Cartesian Charts control.
Range column chart
The range column chart allows you to visualize data points with range columns, making it easy to identify patterns and trends and compare different data sets. This feature is helpful when you need to specify minimum and maximum values for each data point.
XAML
<chart:SfCartesianChart  x:Name="Chart"
                         VerticalOptions="FillAndExpand"
                         Title="{StaticResource title}" >

 <chart:SfCartesianChart.XAxes>
  <chart:CategoryAxis/>
 </chart:SfCartesianChart.XAxes>

 <chart:SfCartesianChart.YAxes >
  <chart:NumericalAxis/>
 </chart:SfCartesianChart.YAxes>

 <chart:RangeColumnSeries ItemsSource="{Binding TemperatureData}"
                          XBindingPath="Name"
                          High="Value"
                          Low="Size"/>
</chart:SfCartesianChart>
Bubble chart
The bubble chart is a visually appealing tool for representing data with multiple dimensions, as the size of the bubbles indicates an additional data dimension. This makes it easy to compare the values of different data points and provides a more comprehensive view of the data.
XAML
<chart:SfCartesianChart>

 <chart:SfCartesianChart.XAxes>
  <chart:NumericalAxis/>
 </chart:SfCartesianChart.XAxes>

 <chart:SfCartesianChart.YAxes>
  <chart:NumericalAxis/>
 </chart:SfCartesianChart.YAxes>

 <chart:BubbleSeries  ItemsSource="{Binding Data}"
                      XBindingPath="Value"
                      YBindingPath="High"
                      SizeValuePath="Low"/>
</chart:SfCartesianChart>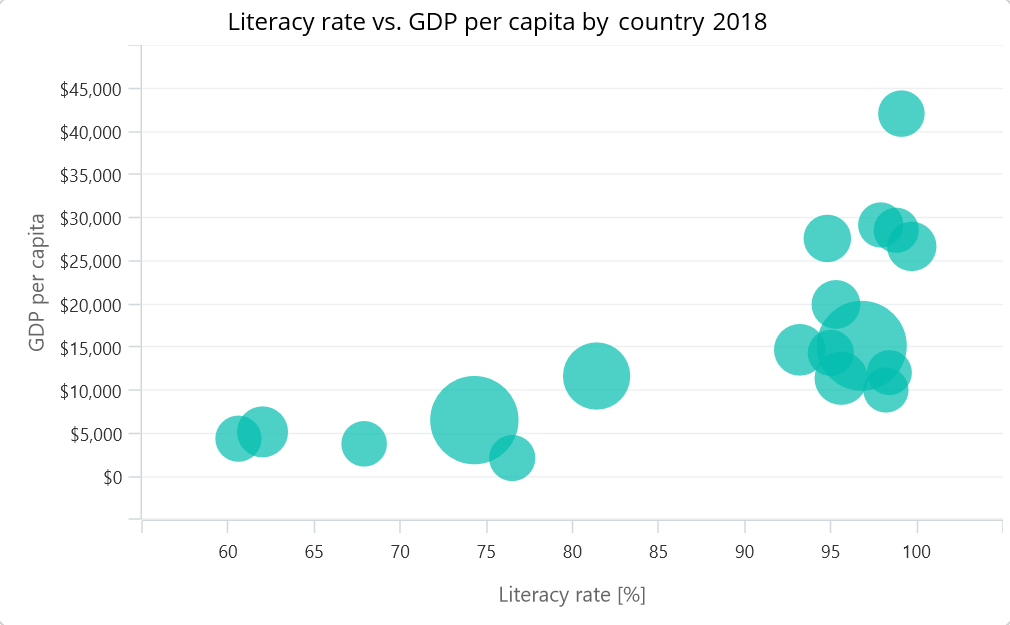
Stacked column chart
A stacked column chart comprises multiple column series placed on top of one another. The height of each column is determined by the value of the data point it represents, allowing for a way to display the cumulative value of data points. This helps us identify the patterns and trends in the data quickly.
XAML
<chart:SfCartesianChart>

 <chart:SfCartesianChart.XAxes>
  <chart:CategoryAxis/>
 </chart:SfCartesianChart.XAxes>

 <chart:SfCartesianChart.YAxes >
  <chart:NumericalAxis/>
 </chart:SfCartesianChart.YAxes>

 <chart:StackingColumnSeries XBindingPath="Year"
                             YBindingPath="Personal"
                             ItemsSource="{Binding RevenueData}"/>

 <chart:StackingColumnSeries XBindingPath="Year"
                             YBindingPath="HomeCare"
                             ItemSource="{Binding RevenueData}"/>

 <chart:StackingColumnSeries  XBindingPath="Year"
                              YBindingPath="Others"
                              ItemsSource="{Binding RevenueData}"/>
</chart:SfCartesianChart>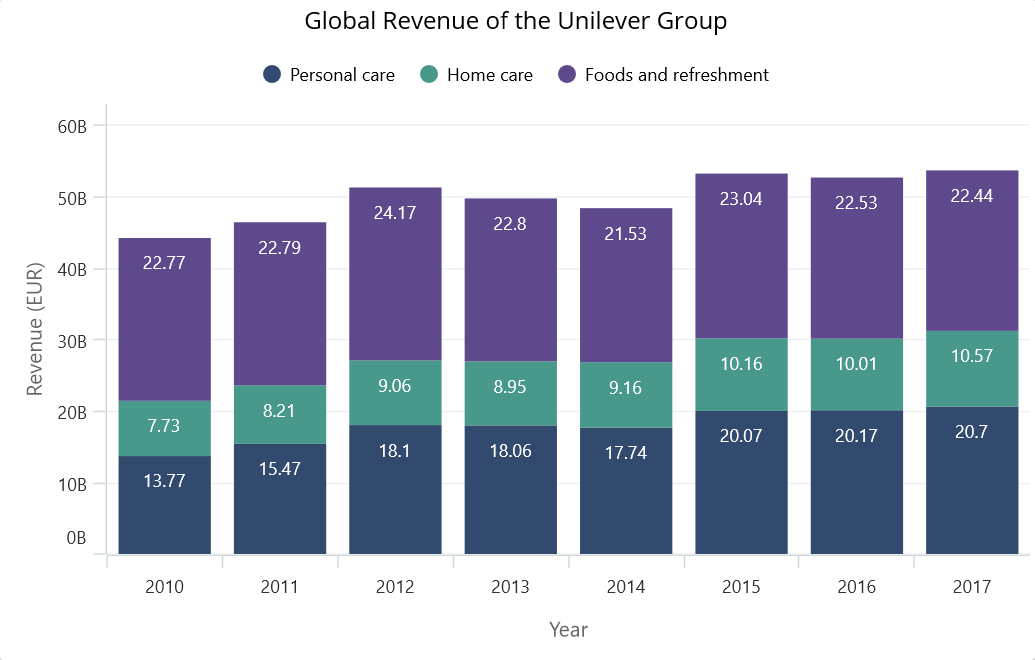
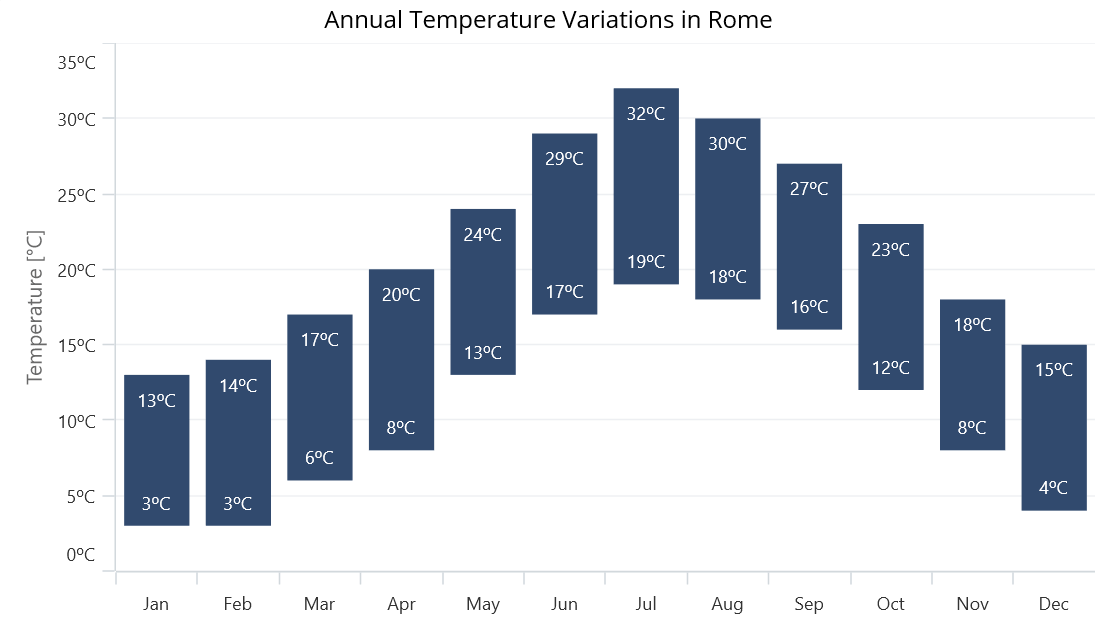
Waterfall chart
The waterfall chart is used to represent the cumulative effect of positive and negative values visually. It shows rectangles connected to each other, making it easy to understand the impact of each value on the overall total.
XAML
<chart:SfCartesianChart>

 <chart:SfCartesianChart.XAxes >
  <chart:CategoryAxis/>
 </chart:SfCartesianChart.XAxes>

 <chart:SfCartesianChart.YAxes>
  <chart:NumericalAxis/>
 </chart:SfCartesianChart.YAxes>

 <chart:WaterfallSeries ItemsSource="{Binding RevenueDetails}"
                        AllowAutoSum="True"
                        XBindingPath="Department"
                        YBindingPath="Value"
                        SummaryBindingPath="IsSummary">

 </chart:WaterfallSeries>
</chart:SfCartesianChart>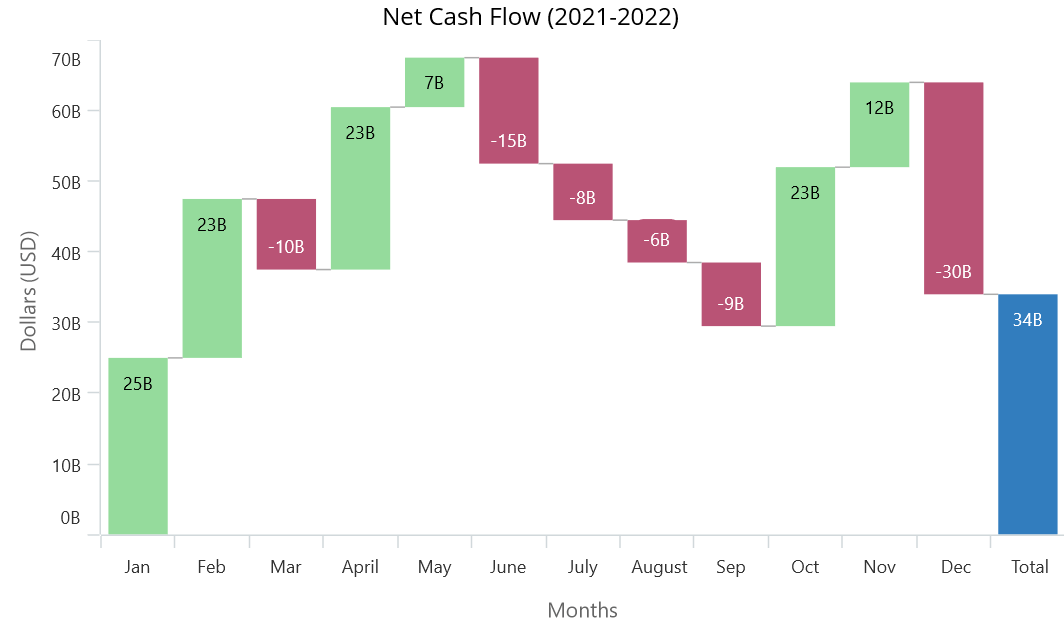
Box and whisker chart
A box and whisker chart provides a standardized and concise way of displaying data distribution and identifying outliers. It allows users to represent data as a box plot, highlighting the minimum, first quartile, median, third quartile, and maximum values in a data set.
XAML
<chart:SfCartesianChart>

 <chart:SfCartesianChart.XAxes>
  <chart:CategoryAxis x:Name="xAxis"/>
 </chart:SfCartesianChart.XAxes>

 <chart:SfCartesianChart.YAxes>
  <chart:NumericalAxis/>
 </chart:SfCartesianChart.YAxes>

 <chart:BoxAndWhiskerSeries ItemsSource="{Binding DataSets}"
                            XBindingPath="Levels"
                            YBindingPath="Energy"
                            ShowOutlier="True"
                            ShowMedian="True"/>
</chart:SfCartesianChart>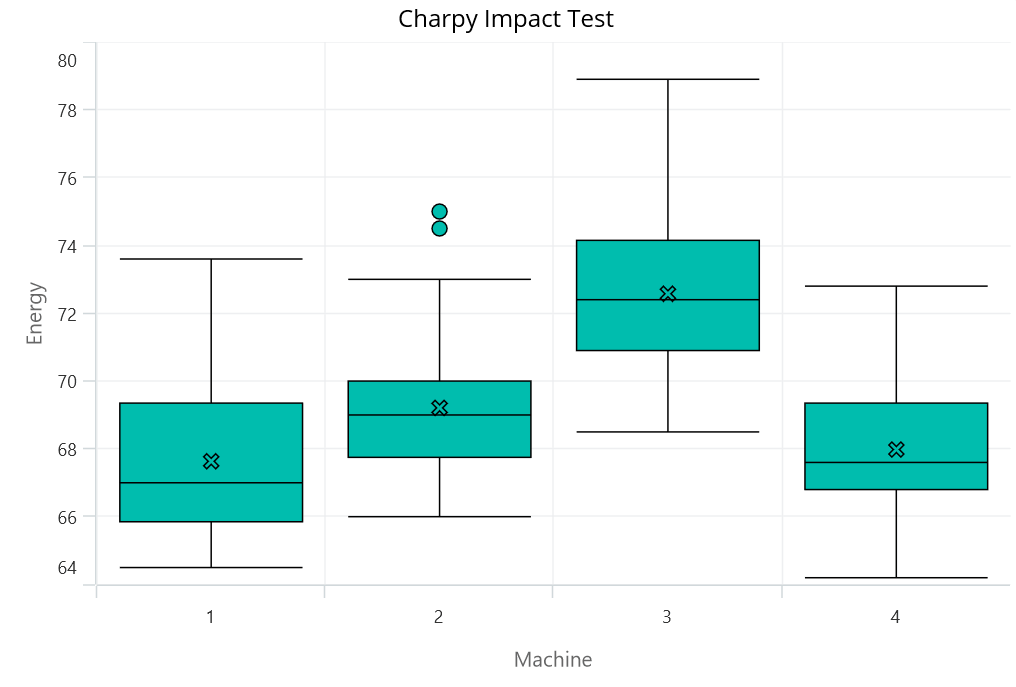
Error bar chart
Error bars are used to indicate errors or uncertainties in reported values. They help predict the potential measurement deviations in data.
XAML
<chart:SfCartesianChart>

 <chart:SfCartesianChart.XAxes>
  <chart:CategoryAxis/>
 </chart:SfCartesianChart.XAxes>

 <chart:SfCartesianChart.YAxes>
  <chart:NumericalAxis/>
 </chart:SfCartesianChart.YAxes>

 <chart:ColumnSeries  ItemsSource="{Binding ThermalExpansion}"
                      XBindingPath="Name"
                      YBindingPath="Value"
                      Fill="#95DB9C"/>

 <chart:ErrorBarSeries ItemsSource="{Binding ThermalExpansion}"
                       XBindingPath="Name"
                       YBindingPath="Value"
                       Mode="Vertical"
                       Type="Custom"/>
</chart:SfCartesianChart>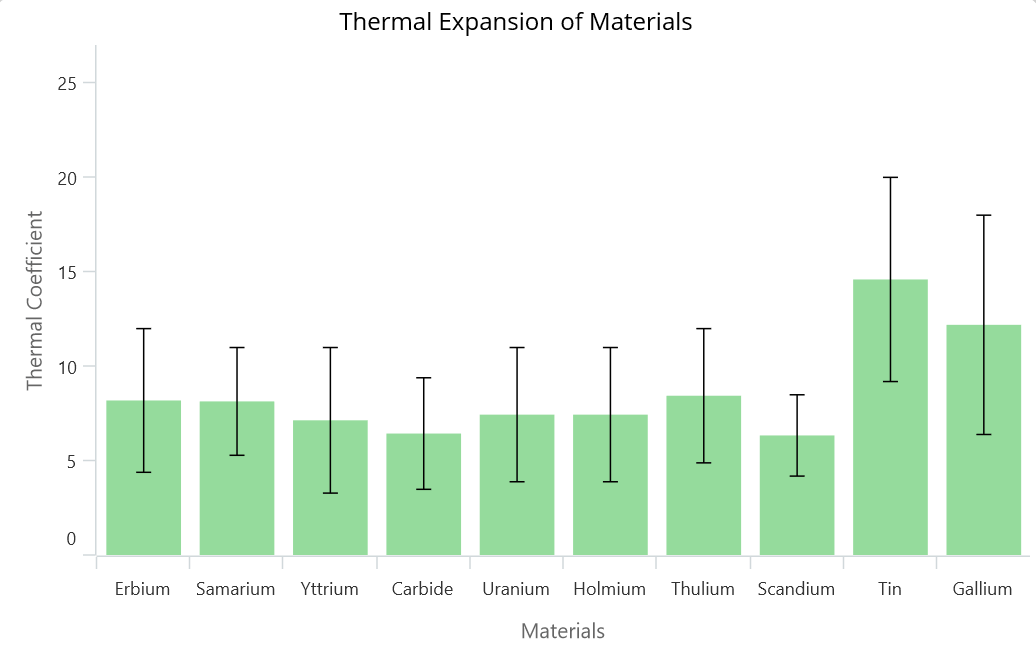
New chart type in .NET MAUI Circular Charts
Radial bar chart
Radial bars are visually appealing and an effective way to compare categories in data using circular shapes. This distinctive design allows easy comparison while also providing an attractive visual.
XAML
<chart:SfCircularChart>
    . . .
 <chart:RadialBarSeries x:Name="radialBarSeries"
                        ItemsSource="{Binding RadialBarSeriesData}"
                        XBindingPath="Name"
                        YBindingPath="Value"/>
</chart:SfCircularChart>
Exporting chart
Now, you can export our .NET MAUI charts to image formats such as JPEG and PNG. This will make it easier for users to share their charts with others.
C#
SfCartesianChart chart = new SfCartesianChart();
...
chart.SaveAsImage("ChartSample.jpeg");
Conclusion
Thanks for reading! In this blog, we have seen the new chart types and features added to Syncfusion’s .NET MAUI charts controls for the 2023 Volume 1 release. Use these features to enhance the readability of your chart data.
You can see the other new features in the 2023 Volume 3 release by reading our release notes and What’s New pages. Feel free to look at our .NET MAUI controls’ GitHub demos and documentation.
Submit your questions or feature requests in the comments section below. You can also reach us through our support forums, support portal, or feedback portal. We are always happy to assist you!


 No spam, just valuable updates.